Updated: June 26, 2021
In this post, we will see how to deploy Prometheus and Grafana using Helm and Prometheus Operator to monitor Tanzu Kubernetes clusters.

curl https://raw.githubusercontent.com/kubernetes/helm/master/scripts/get-helm-3 > get_helm.sh
chmod 700 get_helm.sh
./get_helm.sh
helm repo add prometheus-community https://prometheus-community.github.io/helm-charts
helm repo update
helm install pro-mon -n pro-mon prometheus-community/kube-prometheus-stack

Verify all
Port forward Grafana to 3000 to access the dashboards
Login to Grafana using a web browser at localhost:3000/login .
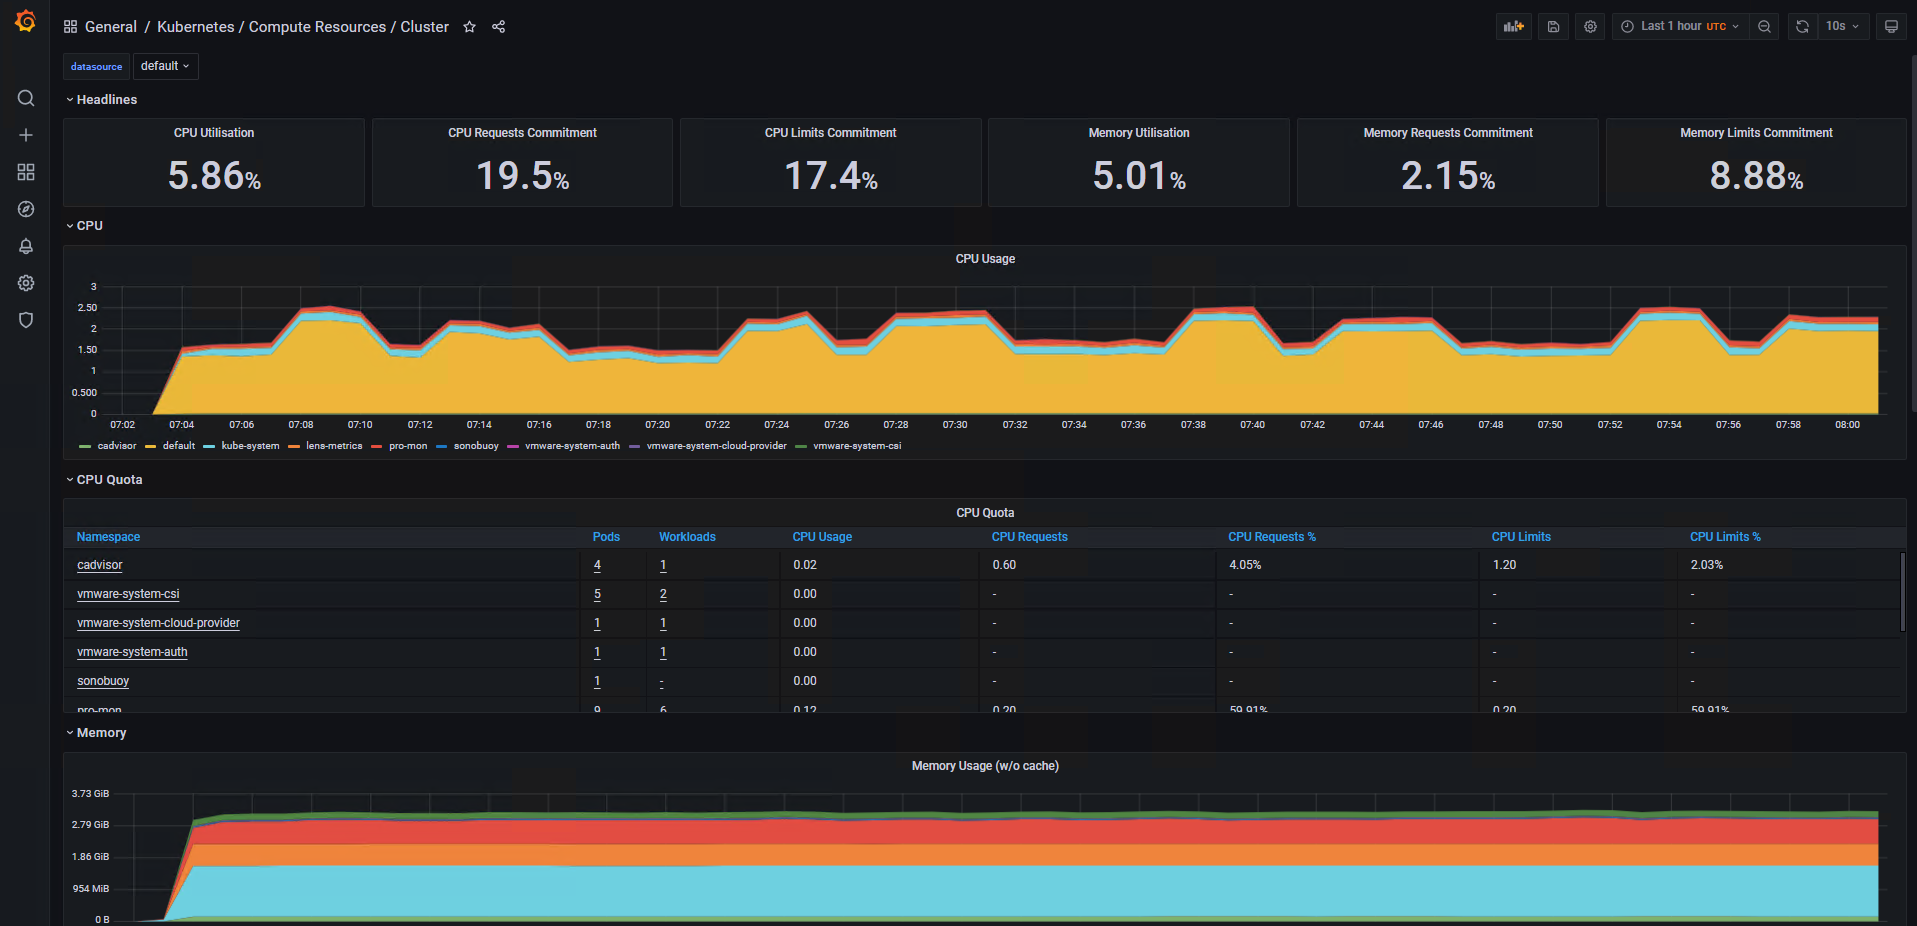
Go to Dashboards - Manage to view/ access the list of out-of-the-box K8s dashboards. The following are some of the sample dashboards.
Kubernetes | Compute Resources | Namespace (Pods)
Kubernetes | Networking | Namespace (Pods)
Kubernetes | API server


The default username is "admin" and the password is "prom-operator".


This is not limited to just Tanzu K8s clusters. You can also monitor OpenShift and Upstream K8s clusters following this method. Hope it was useful. Cheers!
References
https://github.com/prometheus-community/helm-charts/tree/main/charts/kube-prometheus-stack
[www.bogotobogo.com] Docker_Kubernetes_Prometheus_Deploy_using_Helm_and_Prometheus_Operator


