Monday, January 1, 2018

Avoid disasters in PowerShell

WhatIf

If you are unsure about the operation or action that is going to happen after executing a PowerShell cmdlet, use "WhatIf". This will tell you what it will do without actually doing it. So that you will have an understanding of what the cmdlet is going to perform. Consider the below PS statement. 

Get-Service | where {$PSItem.name -eq "bits"} | Start-Service

Lets assume that you are unsure of what the above statement will do. Add -WhatIf at the end and execute it.

Get-Service | where {$PSItem.name -eq "bits"} | Start-Service -WhatIf


Example: WhatIf


The above screenshot explains the operation that will perform if you execute the statement. In this case it will start the BITS service. 

Confirm

Lets consider another scenario where you want to confirm the action from the user before actually executing it straight away. You can use "Confirm" in this case. See the below example. 

Clear-EventLog -LogName System -Confirm

Example: Confirm

Saturday, December 30, 2017

Get Windows event logs for last 24 hours using PowerShell

Analyzing Windows event logs is one of the daily tasks of most IT administrators. And especially if you have more number of servers in your ownership, filtering the relevant events using PowerShell will save a lot of time.

Here I am showing an example of filtering errors from System logs of last 24 hours.

Get all system event logs: Get-eventlog -LogName System
Filtering error events: Get-eventlog -LogName System -EntryType Error
Filtering again to last 24 hours: Get-eventlog -LogName System -EntryType Error -After (Get-Date).AddDays(-1)

Now you may want to select the event id, time generated and corresponding message and then write it to a html file.

Get-eventlog -LogName System -EntryType Error -After (Get-Date).AddDays(-1) | select EventID, TimeGenerated, Message |  convertto-html | Out-File C:\errorlist.htm

Reference: Get-Help Get-eventlog -ShowWindow

Microsoft PowerShell Help System

In this article I will explain briefly about the different ways of using "help" in PowerShell. "Help" is the most important and useful thing that you should be familiar with while kick-starting PowerShell (PS) learning. This post is aimed at beginners who are new to PS.

If you are using PS Version 3.0 or higher you can always update the help system online. To check the version of PS: $PSVersionTable


To update help online: update-help -Force
This will download and install latest help content on your machine.


Now, lets have a quick look at how the PS cmdlets are organized. Take the example of update-help itself and you can see its a verb-noun format. Update is a verb which is an action and help is the noun. 

If you are not sure about the different verbs available in PS, list all the verbs using: get-verb 

To find out all the 'Get' commands, you can simply use: get-help Get*

Lets pick Get-Service as an example and want to know more about this cmdlet. You can use the help system in the following ways.

Get-Help Get-Service
Get-Help Get-Service -Detailed
Get-Help Get-Service -Full
Get-Help Get-Service -Examples
Get-Help Get-Service -ShowWindow
Get-Help Get-Service -Online

Reference video: 

Wednesday, December 27, 2017

Infrastructure testing using Pester - Part 1

Pester provides a framework to test PowerShell code. Now, you might have a question, "Why to invest time to test your code? What's the point?". Yes, testing the code will take some time. But in a long run it will provide you a reliable code, prevents regression bugs, you have a clear definition of what is "working", you can trust your code and will help you develop better coding practices. You can also use Pester to test and validate your infrastructure. This is what I will be explaining in the article.

Thanks to my friend Deepak dexterposh.com for helping me kick-start Pester and pointing me in the right direction.

Infrastructure testing is nothing but reading/ fetching the current state of the infrastructure and compare it with a known or expected state. Below diagram explains this.


The real benefits of testing your infrastructure is that you have a clear-cut definition of the expected states, helps you quickly point out if something deviates from the expected behavior and finally you will have reliable deployments. You can perform infrastructure testing right after a change is implemented. This simply means the test will validate the environment to make sure everything is working as expected. 

Pester module is available on Windows Server 2016 and Windows 10 by default. You can verify the version of Pester installed using: Get-Module -ListAvailable -Name Pester


To find the most recent version of Pester from PSGallery: Find-Module -Name Pester


To install the required version: Install-Module -Name Pester -RequiredVersion 4.1.1 -Force


Now, lets get into infrastructure testing. The first thing you will need to have is a set of things that you need to test and their expected behavior. Lets have a look at the syntax and some simple examples. 

Syntax:

Describe "***text***" {
    Context "***text***" {
        It "***text***" {

                   ## actual test will be written here
        }
    }
}

"Describe" block is a grouping of individual tests. The tests are actually defined in "It" blocks. A describe block can have multiple it blocks. "Context" blocks serve as logical groups. It is like sub grouping. Multiple context blocks inside a describe block is also possible.

Should is a command used inside It blocks to compare objects and there are several should operators such as: Be, BeExactly, BeLike, Match etc. Some of them are used in the below examples. Visit GitHub Pester Wiki for command references.

Examples:
--------------------------------------------------------------------------------------------------

#Example 1
#Verify the file system type and allocation unit size (AUS) of a drive in a machine 
#Expected state: Drive D - File system type should be REFS and AUS should be 4K (4096 Bytes)

Describe "Verify drive D" {
    Context "Check file system type and AUS" {
        It "Should be REFS" {
            $drive_stat = fsutil fsinfo statistics D:
            ($drive_stat[0]) -match ([regex]::Escape("File System Type :     REFS")) | Should Be $true 
        }
        It "Should have 4K AUS" {
            $AUS_stat = fsutil fsinfo refsinfo D:
            ($AUS_stat[8]) -match ([regex]::Escape("Bytes Per Cluster :               4096")) | Should Be $true
        }
    }
}

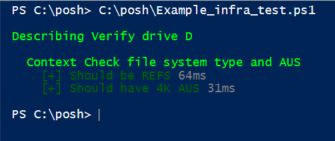
Output:


Here you can see the test passed (Green!) as drive D is having REFS file system and AUS 4K.

--------------------------------------------------------------------------------------------------

#Example 2
#Check presence of Hyper-V virtual switch named "Corp"
#Verify the vSwitch type and the network adapter associated with it
#Expected state: vSwitch named "Corp" should have connection to external network and should be using network adapter "QLogic BCM57800 Gigabit Ethernet (NDIS VBD Client) #44"

Describe "Verify Hyper-V vSwitch" {
    Context "Check for Corp vSwitch, its type and connected NIC" {
        
        $check = Get-VMSwitch | where name -eq Corp

        It "Corp vSwitch should be present" {
            ($check.Name) | Should -BeExactly "Corp"
        }
        It "Corp vSwitch type should be External" {
            ($check.SwitchType) | Should -BeExactly "External"   
        }
        It "Corp vSwitch should be connected to QLogic BCM57800 Gigabit Ethernet (NDIS VBD Client) #44" {
            ($check.NetAdapterInterfaceDescription) | Should -BeExactly "BCM57800 Gigabit Ethernet (NDIS VBD Client) #44"
        }          
    }
}

Output:


Here two tests passed and one failed. 
The failed test shows the clear reason why it is failed.
Expected: {BCM57800 Gigabit Ethernet (NDIS VBD Client) #44}
But was:  {QLogic BCM57800 10 Gigabit Ethernet (NDIS VBD Client) #41}

--------------------------------------------------------------------------------------------------

Now, if I combine the above two examples together (verify drive D and the vSwitch Corp) into a single test, the output will be:


You can also use: Invoke-Pester -Script .\Example_infra_test.ps1 
This will run all the test and will return you the number of tests passed, failed, skipped etc. as shown below.


Thursday, November 30, 2017

Software Defined Storage using ScaleIO

In this article I will explain briefly about ScaleIO and various options that are available to deploy ScaleIO software defined storage (SDS) solution. 

ScaleIO can be considered as a very good option for customers who are moving towards deploying software defined storage  solutions and hyperconverged infrastructure. As ScaleIO software supports multiple hypervisors and operating systems like VMware ESXi, Hyper-V, RHEL, Windows etc. customers with a heterogeneous IT infrastructure gets the most benefit out of it. Apart from that it offers multiple deployment modes like hyperconverged, two layer and mixed mode. I am sure most of you are very much familiar with the term hyperconverged where compute and storage runs together on the same box. You can scale both compute and storage resources together by adding more and more nodes to your cluster. A two layer mode is nothing but a storage only configuration where you can scale the storage resources separately. It is essentially a virtual SAN infrastructure implemented using ScaleIO SDS. A mixed mode scenario will usually occur when transitioning from storage only configuration to hyperconverged.

Now I will just give an overview on how to deploy ScaleIO on VMware and RHEL platforms. ScaleIO has tight integration with VMware and they provide a powershell script and vCenter plugin to simplify the deployment. In case of RHEL platform, you can use Installation Manager (IM) which is a part of ScaleIO Gateway for quick and easy deployment of ScaleIO cluster. Customers have multiple options to consume ScaleIO. They can just buy the ScaleIO software alone and use commodity x86 hardware to build the cluster (not a great idea for production deployments as they have to figure out and use the validated/ qualified hardware and software components to ensure seamless operation and proper support) or they can buy ScaleIO Ready Nodes which are prevalidated, preconfigured and optimized PowerEdge servers to deploy ScaleIO cluster. Apart from that there is another offering VxRack System Flex which is a rack-scale hyperconverged solution built on Dell EMC PowerEdge servers with integrated Cisco networking and ScaleIO software. 

Lets have a look at the major components of ScaleIO. Below figure shows a 5 node hyperconverged ScaleIO cluster running on a highly available VMware platform. The three main components of ScaleIO are:

  • SDC - ScaleIO Data Client
  • SDS - ScaleIO Data Server
  • MDM - Meta Data Manager


In this scenario, all 5 nodes have ESXi installed and clustered. All nodes have local hard disks present in them. And its the responsibility of ScaleIO software to pool all the hard disks from all 5 nodes forming a distributed virtual SAN.

SDC is a light weight driver which is responsible for presenting LUNs provisioned from the ScaleIO system. SDS is responsible for managing local disks present in each node. MDM contains all the metadata required for system operation and configuration changes. It manages the metadata, SDC, SDS, system capacity, device mappings, volumes, data protection, errors/ failures, rebuild and rebalance operations etc. ScaleIO supports 3 node/ 5 node MDM cluster. Above figure shows a 5 node MDM cluster, where there will be 3 manager MDMs and out of which one will be master and two will be slaves and there will be two Tie-Breaker (TB) which helps in deciding master MDM by maintaining a majority in the cluster. In a production environment with 5 or more nodes, it is recommended to use a 5 node MDM cluster as it can tolerate 2 MDM failures.

ScaleIO uses a distributed two way mesh mirror scheme to protect data against disk or node failures. To ensure QoS it has the capability where you can limit bandwidth as well as IOPS for each volume provisioned from a ScaleIO cluster. And regarding scalability a single ScaleIO cluster supports upto 1024 nodes. In very large ScaleIO deployments it is highly recommended to configure separate protection domains and fault sets to minimize the impact of multiple failures at the same time. 

You can download ScaleIO software for free to test and play around in your lab environment.

References:
Dell EMC ScaleIO Basic Architecture
Dell EMC ScaleIO Design Considerations And Best Practices
Dell EMC ScaleIO Ready Node

Sunday, October 29, 2017

The scientific method of troubleshooting

The aim of this article is to provide a brief guidance for IT administrators, System Engineers and whoever interested on a systematic and established approach to troubleshoot problems.
  1. Define the problem

    To identify the problem ask the below questions.
    1. What is the expected behavior ?
    2. What is the current or actual behavior ?
    3. What is the criteria for success ?
    4. Time frame when the problem started or identified ?
    5. What is the impact of the issue ? What all related services/ who all are affected ?

  2. Do your research

    1. Know your environment.
    2. Collect necessary/ related background information.
    3. Refer existing documentations.
    4. Verify change logs.
    5. Conduct discussions to gather multiple opinions.
    6. Refer knowledge base (KB) to check whether it is a known issue.
    7. Is it possible to reproduce the issue ?
    8. Are there any dependencies associated ?

  3. Establish a hypothesis

    Design an experiment/ test strategy to validate your hypothesis based on the evidence collected in previous step.

  4. Experiment

    1. Isolate the problem by divide and conquer method.
    2. Limit the number of variables while conducting the test.
    3. Follow a hierarchy and figure out what is most likely to cause the problem.

  5. Gather data

    Check the current status by verifying logs, error messages etc.

  6. Analyze results

    1. Verify whether the problem is resolved.
    2. Consolidate the learnings garnered from the troubleshooting efforts.

  7. Document the problem and the solution

    1. Make sure you document the problem and the solution.
    2. Update necessary documentations if any.
    3. Blog it.
And finally, if you have resolved the issue, take a moment to embrace success. Cheers !

Reference video: 


Friday, September 29, 2017

Managing Microsoft Windows Server infrastructure using Honolulu

Honolulu is a browser based management tool set that helps in the administration of Windows servers, failover clusters and hyper-converged clusters in your environment. Microsoft has released the evalution version few days back. You can download the .msi package from https://aka.ms/HonoluluDownload . The application manages Windows Server 2012, Windows Server 2012 R2 and Windows Server 2016 through the Honolulu gateway that you can install on a Windows Server 2016 or Windows 10. The gateway uses Remote PowerShell and WMI over WinRM to manage the servers. If you are having Windows Server 2012/ 2012 R2 in your environment and planning to manage them using Honolulu then you will need to install Windows Management Framework (WMF) version 5.0 or higher on those servers.

The installation is very much straight forward. For the purpose of testing I installed it on a Windows Server 2016. Below screenshot shows the home screen which displays all the available connections. You can use the Add button to add stand alone servers, failover clusters and hyper-converged clusters. Here I have a Failover Cluster with four nodes.


You can set the credentials required to manage your servers and clusters using the Manage As option. Once you select that option, it will ask you to provide the username and password.


You also have a drop down option on the home page to select installed solutions.


Now lets have a quick look at the failover cluster overview.


You can view various details as shown below.

Disks


Networks


Roles


You can also set the preferred owners and start up priority for your virtual machine by selecting the VM and clicking Settings button.

Preferred Onwers and Startup Priority


Failover and Failback policy


Virtual machines

This shows the total number of virtual machines and its state. The resource usage shows the total cluster resource utilization. I think it would make more sense if Microsoft adds the resource usage information in the cluster overview page. You can click on VIEW ALL EVENTS to view the events page.


Events


To manage any of the cluster member nodes, you can select the respective server and click Manage as shown below.

Nodes


It will redirect to server manager page where you have multiple options to manage your server.

Server manager


You can use the server manager page to add/ remove roles and features, manage services, create/ enable/ disable firewall rules, create vswitches, install windows updates, restart the server etc.

Reference: Microsoft