Saturday, December 30, 2017

Get Windows event logs for last 24 hours using PowerShell

Analyzing Windows event logs is one of the daily tasks of most IT administrators. And especially if you have more number of servers in your ownership, filtering the relevant events using PowerShell will save a lot of time.

Here I am showing an example of filtering errors from System logs of last 24 hours.

Get all system event logs: Get-eventlog -LogName System
Filtering error events: Get-eventlog -LogName System -EntryType Error
Filtering again to last 24 hours: Get-eventlog -LogName System -EntryType Error -After (Get-Date).AddDays(-1)

Now you may want to select the event id, time generated and corresponding message and then write it to a html file.

Get-eventlog -LogName System -EntryType Error -After (Get-Date).AddDays(-1) | select EventID, TimeGenerated, Message |  convertto-html | Out-File C:\errorlist.htm

Reference: Get-Help Get-eventlog -ShowWindow

Microsoft PowerShell Help System

In this article I will explain briefly about the different ways of using "help" in PowerShell. "Help" is the most important and useful thing that you should be familiar with while kick-starting PowerShell (PS) learning. This post is aimed at beginners who are new to PS.

If you are using PS Version 3.0 or higher you can always update the help system online. To check the version of PS: $PSVersionTable


To update help online: update-help -Force
This will download and install latest help content on your machine.


Now, lets have a quick look at how the PS cmdlets are organized. Take the example of update-help itself and you can see its a verb-noun format. Update is a verb which is an action and help is the noun. 

If you are not sure about the different verbs available in PS, list all the verbs using: get-verb 

To find out all the 'Get' commands, you can simply use: get-help Get*

Lets pick Get-Service as an example and want to know more about this cmdlet. You can use the help system in the following ways.

Get-Help Get-Service
Get-Help Get-Service -Detailed
Get-Help Get-Service -Full
Get-Help Get-Service -Examples
Get-Help Get-Service -ShowWindow
Get-Help Get-Service -Online

Reference video: 

Wednesday, December 27, 2017

Infrastructure testing using Pester - Part 1

Pester provides a framework to test PowerShell code. Now, you might have a question, "Why to invest time to test your code? What's the point?". Yes, testing the code will take some time. But in a long run it will provide you a reliable code, prevents regression bugs, you have a clear definition of what is "working", you can trust your code and will help you develop better coding practices. You can also use Pester to test and validate your infrastructure. This is what I will be explaining in the article.

Thanks to my friend Deepak dexterposh.com for helping me kick-start Pester and pointing me in the right direction.

Infrastructure testing is nothing but reading/ fetching the current state of the infrastructure and compare it with a known or expected state. Below diagram explains this.


The real benefits of testing your infrastructure is that you have a clear-cut definition of the expected states, helps you quickly point out if something deviates from the expected behavior and finally you will have reliable deployments. You can perform infrastructure testing right after a change is implemented. This simply means the test will validate the environment to make sure everything is working as expected. 

Pester module is available on Windows Server 2016 and Windows 10 by default. You can verify the version of Pester installed using: Get-Module -ListAvailable -Name Pester


To find the most recent version of Pester from PSGallery: Find-Module -Name Pester


To install the required version: Install-Module -Name Pester -RequiredVersion 4.1.1 -Force


Now, lets get into infrastructure testing. The first thing you will need to have is a set of things that you need to test and their expected behavior. Lets have a look at the syntax and some simple examples. 

Syntax:

Describe "***text***" {
    Context "***text***" {
        It "***text***" {

                   ## actual test will be written here
        }
    }
}

"Describe" block is a grouping of individual tests. The tests are actually defined in "It" blocks. A describe block can have multiple it blocks. "Context" blocks serve as logical groups. It is like sub grouping. Multiple context blocks inside a describe block is also possible.

Should is a command used inside It blocks to compare objects and there are several should operators such as: Be, BeExactly, BeLike, Match etc. Some of them are used in the below examples. Visit GitHub Pester Wiki for command references.

Examples:
--------------------------------------------------------------------------------------------------

#Example 1
#Verify the file system type and allocation unit size (AUS) of a drive in a machine 
#Expected state: Drive D - File system type should be REFS and AUS should be 4K (4096 Bytes)

Describe "Verify drive D" {
    Context "Check file system type and AUS" {
        It "Should be REFS" {
            $drive_stat = fsutil fsinfo statistics D:
            ($drive_stat[0]) -match ([regex]::Escape("File System Type :     REFS")) | Should Be $true 
        }
        It "Should have 4K AUS" {
            $AUS_stat = fsutil fsinfo refsinfo D:
            ($AUS_stat[8]) -match ([regex]::Escape("Bytes Per Cluster :               4096")) | Should Be $true
        }
    }
}

Output:


Here you can see the test passed (Green!) as drive D is having REFS file system and AUS 4K.

--------------------------------------------------------------------------------------------------

#Example 2
#Check presence of Hyper-V virtual switch named "Corp"
#Verify the vSwitch type and the network adapter associated with it
#Expected state: vSwitch named "Corp" should have connection to external network and should be using network adapter "QLogic BCM57800 Gigabit Ethernet (NDIS VBD Client) #44"

Describe "Verify Hyper-V vSwitch" {
    Context "Check for Corp vSwitch, its type and connected NIC" {
        
        $check = Get-VMSwitch | where name -eq Corp

        It "Corp vSwitch should be present" {
            ($check.Name) | Should -BeExactly "Corp"
        }
        It "Corp vSwitch type should be External" {
            ($check.SwitchType) | Should -BeExactly "External"   
        }
        It "Corp vSwitch should be connected to QLogic BCM57800 Gigabit Ethernet (NDIS VBD Client) #44" {
            ($check.NetAdapterInterfaceDescription) | Should -BeExactly "BCM57800 Gigabit Ethernet (NDIS VBD Client) #44"
        }          
    }
}

Output:


Here two tests passed and one failed. 
The failed test shows the clear reason why it is failed.
Expected: {BCM57800 Gigabit Ethernet (NDIS VBD Client) #44}
But was:  {QLogic BCM57800 10 Gigabit Ethernet (NDIS VBD Client) #41}

--------------------------------------------------------------------------------------------------

Now, if I combine the above two examples together (verify drive D and the vSwitch Corp) into a single test, the output will be:


You can also use: Invoke-Pester -Script .\Example_infra_test.ps1 
This will run all the test and will return you the number of tests passed, failed, skipped etc. as shown below.


Thursday, November 30, 2017

Software Defined Storage using ScaleIO

In this article I will explain briefly about ScaleIO and various options that are available to deploy ScaleIO software defined storage (SDS) solution. 

ScaleIO can be considered as a very good option for customers who are moving towards deploying software defined storage  solutions and hyperconverged infrastructure. As ScaleIO software supports multiple hypervisors and operating systems like VMware ESXi, Hyper-V, RHEL, Windows etc. customers with a heterogeneous IT infrastructure gets the most benefit out of it. Apart from that it offers multiple deployment modes like hyperconverged, two layer and mixed mode. I am sure most of you are very much familiar with the term hyperconverged where compute and storage runs together on the same box. You can scale both compute and storage resources together by adding more and more nodes to your cluster. A two layer mode is nothing but a storage only configuration where you can scale the storage resources separately. It is essentially a virtual SAN infrastructure implemented using ScaleIO SDS. A mixed mode scenario will usually occur when transitioning from storage only configuration to hyperconverged.

Now I will just give an overview on how to deploy ScaleIO on VMware and RHEL platforms. ScaleIO has tight integration with VMware and they provide a powershell script and vCenter plugin to simplify the deployment. In case of RHEL platform, you can use Installation Manager (IM) which is a part of ScaleIO Gateway for quick and easy deployment of ScaleIO cluster. Customers have multiple options to consume ScaleIO. They can just buy the ScaleIO software alone and use commodity x86 hardware to build the cluster (not a great idea for production deployments as they have to figure out and use the validated/ qualified hardware and software components to ensure seamless operation and proper support) or they can buy ScaleIO Ready Nodes which are prevalidated, preconfigured and optimized PowerEdge servers to deploy ScaleIO cluster. Apart from that there is another offering VxRack System Flex which is a rack-scale hyperconverged solution built on Dell EMC PowerEdge servers with integrated Cisco networking and ScaleIO software. 

Lets have a look at the major components of ScaleIO. Below figure shows a 5 node hyperconverged ScaleIO cluster running on a highly available VMware platform. The three main components of ScaleIO are:

  • SDC - ScaleIO Data Client
  • SDS - ScaleIO Data Server
  • MDM - Meta Data Manager


In this scenario, all 5 nodes have ESXi installed and clustered. All nodes have local hard disks present in them. And its the responsibility of ScaleIO software to pool all the hard disks from all 5 nodes forming a distributed virtual SAN.

SDC is a light weight driver which is responsible for presenting LUNs provisioned from the ScaleIO system. SDS is responsible for managing local disks present in each node. MDM contains all the metadata required for system operation and configuration changes. It manages the metadata, SDC, SDS, system capacity, device mappings, volumes, data protection, errors/ failures, rebuild and rebalance operations etc. ScaleIO supports 3 node/ 5 node MDM cluster. Above figure shows a 5 node MDM cluster, where there will be 3 manager MDMs and out of which one will be master and two will be slaves and there will be two Tie-Breaker (TB) which helps in deciding master MDM by maintaining a majority in the cluster. In a production environment with 5 or more nodes, it is recommended to use a 5 node MDM cluster as it can tolerate 2 MDM failures.

ScaleIO uses a distributed two way mesh mirror scheme to protect data against disk or node failures. To ensure QoS it has the capability where you can limit bandwidth as well as IOPS for each volume provisioned from a ScaleIO cluster. And regarding scalability a single ScaleIO cluster supports upto 1024 nodes. In very large ScaleIO deployments it is highly recommended to configure separate protection domains and fault sets to minimize the impact of multiple failures at the same time. 

You can download ScaleIO software for free to test and play around in your lab environment.

References:
Dell EMC ScaleIO Basic Architecture
Dell EMC ScaleIO Design Considerations And Best Practices
Dell EMC ScaleIO Ready Node

Sunday, October 29, 2017

The scientific method of troubleshooting

The aim of this article is to provide a brief guidance for IT administrators, System Engineers and whoever interested on a systematic and established approach to troubleshoot problems.
  1. Define the problem

    To identify the problem ask the below questions.
    1. What is the expected behavior ?
    2. What is the current or actual behavior ?
    3. What is the criteria for success ?
    4. Time frame when the problem started or identified ?
    5. What is the impact of the issue ? What all related services/ who all are affected ?

  2. Do your research

    1. Know your environment.
    2. Collect necessary/ related background information.
    3. Refer existing documentations.
    4. Verify change logs.
    5. Conduct discussions to gather multiple opinions.
    6. Refer knowledge base (KB) to check whether it is a known issue.
    7. Is it possible to reproduce the issue ?
    8. Are there any dependencies associated ?

  3. Establish a hypothesis

    Design an experiment/ test strategy to validate your hypothesis based on the evidence collected in previous step.

  4. Experiment

    1. Isolate the problem by divide and conquer method.
    2. Limit the number of variables while conducting the test.
    3. Follow a hierarchy and figure out what is most likely to cause the problem.

  5. Gather data

    Check the current status by verifying logs, error messages etc.

  6. Analyze results

    1. Verify whether the problem is resolved.
    2. Consolidate the learnings garnered from the troubleshooting efforts.

  7. Document the problem and the solution

    1. Make sure you document the problem and the solution.
    2. Update necessary documentations if any.
    3. Blog it.
And finally, if you have resolved the issue, take a moment to embrace success. Cheers !

Reference video: 


Friday, September 29, 2017

Managing Microsoft Windows Server infrastructure using Honolulu

Honolulu is a browser based management tool set that helps in the administration of Windows servers, failover clusters and hyper-converged clusters in your environment. Microsoft has released the evalution version few days back. You can download the .msi package from https://aka.ms/HonoluluDownload . The application manages Windows Server 2012, Windows Server 2012 R2 and Windows Server 2016 through the Honolulu gateway that you can install on a Windows Server 2016 or Windows 10. The gateway uses Remote PowerShell and WMI over WinRM to manage the servers. If you are having Windows Server 2012/ 2012 R2 in your environment and planning to manage them using Honolulu then you will need to install Windows Management Framework (WMF) version 5.0 or higher on those servers.

The installation is very much straight forward. For the purpose of testing I installed it on a Windows Server 2016. Below screenshot shows the home screen which displays all the available connections. You can use the Add button to add stand alone servers, failover clusters and hyper-converged clusters. Here I have a Failover Cluster with four nodes.


You can set the credentials required to manage your servers and clusters using the Manage As option. Once you select that option, it will ask you to provide the username and password.


You also have a drop down option on the home page to select installed solutions.


Now lets have a quick look at the failover cluster overview.


You can view various details as shown below.

Disks


Networks


Roles


You can also set the preferred owners and start up priority for your virtual machine by selecting the VM and clicking Settings button.

Preferred Onwers and Startup Priority


Failover and Failback policy


Virtual machines

This shows the total number of virtual machines and its state. The resource usage shows the total cluster resource utilization. I think it would make more sense if Microsoft adds the resource usage information in the cluster overview page. You can click on VIEW ALL EVENTS to view the events page.


Events


To manage any of the cluster member nodes, you can select the respective server and click Manage as shown below.

Nodes


It will redirect to server manager page where you have multiple options to manage your server.

Server manager


You can use the server manager page to add/ remove roles and features, manage services, create/ enable/ disable firewall rules, create vswitches, install windows updates, restart the server etc.

Reference: Microsoft 

Thursday, August 31, 2017

Benchmarking hyper-converged vSphere environment using HCIBench

In this article I will explain briefly about using HCIBench for storage benchmarking vSphere deployments. I recently had a chance to try HCIBench on a ScaleIO cluster running on a 3 node ESXi 6.0 cluster. Latest version of the tool can be downloaded from here.

I conducted the tests with HCIBench version 1.6.5.1.  Installation steps are very straight forward. You can install it on one of the ESXi nodes using "Deploy OVF Template" option.

*Browse and select the template.
*Provide a name and select location.
*Select a resource to host HCIBench.
*Review details and click Next.
*Accept license agreements.
*Select a datastore to store HCIBench files.
*Select networks (as shown below).


Note:
Public network is the network through which you can access management web GUI of HCIBench.
Private network is the network where HCIBench test VMs will be deployed.

*Provide management IP details (I am using static IP)  and root password for HCIBench  as shown below.


*Click Next and Finish.
*Once the deployment is complete, you can power on the HCIBench VM.
*Web GUI can be accessed by: <IP address>:8080
*Provide root credentials to access the configuration page.

In the configuration page fill the necessary details as given below.

*vCenter IP.
*vCenter username and password.
*Datacenter name.
*Cluster name.
*Network name (the network on which HCIBench test VMs will be deployed).

Note:
The network on to which HCIBench test VMs will be deployed should have a DHCP server to provide IPs to the test VMs. If you do not have a DHCP server available in that network, select "Set Static IP for Vdbench VMs" as shown below. In this case HCIBench will provide IPs to the test VMs through the private network that you have chosen in the earlier installation step. Here, I don't have a DHCP server in VMNet-SIO network. So I connected eth1 of HCIBench to VMNet-SIO (private network) and checked the option "Set Static IP for Vdbench VMs".

*Provide datastore names.


*Provide ESXi host username and password.
*Total number of VMs.
*Number of data disks per VM.
*Size of each data disk.

Note:
Make sure to keep a ratio between the total number of datastores, number of ESXi nodes and the number of test VMs. Here I have 3 ESXi nodes and 3 datastores in the cluster. So if I deploy 9 VMs for the test, each ESXi node will host 3 test VMs, one on each datastore. 


*Give a name for the test.
*Select the test parameters.
*You can use the Generate button to customize the parameters (shown in next screenshot).


*Input parameters as per your requirement and submit.


*If you are doing this the very first time, you will find the below option at the end of the page to upload Vdbench ZIP file. You can upload the file if you have one, or you can download it from the Oracle website using the Download button.
*After providing necessary inputs, you can save the configuration and validate. If the validation passes, you can click on test to begin the benchmarking test.


*Once the test is complete, click on the Result button and it will take you to the directory where result files are stored. 

Hope the article was useful to you. Happy benchmarking. Cheers!

Tuesday, July 18, 2017

Best practices while building a Hyper-V host

This article explains briefly about some of the best practice considerations while building a stand-alone Hyper-V 2012 R2/ 2016 host. You can use any compatible hardware, but here I will be explaining using Dell PowerEdge servers as I am working with them everyday.

  1. Select proper hardware

    You have to be really careful before purchasing a server. Analyze the requirements first and work a bit on capacity planning too. For example, PowerEdge R630 will be a good choice to start with as it is a 1U system with 2 processors. It can have up to 1.5 TB memory, but generally most SMB customers go with somewhere around 128 GB. Choosing the right network controller is also very important as it directly impacts the data transfer performance of the virtual machines. If you are planning to use converged networking on the host, select appropriate adapter. I recommend using one 10G dual port network card at the minimum for a converged network configuration. If you are looking for redundancy at network card level, then you can go with two 10G dual port cards. You can also go forward with multiple dual port or quad port 1G cards as per your requirements in case of budget limitations.  

  2. Number of disks, type of disks and RAID controller

    On a stand alone host, mostly customers will be using the local drives and if they need additional storage it will be provisioned from a SAN. The number of disks and the type of disks (SSD, SAS, NL-SAS etc.) will have direct impact on performance at storage level. Also, it is very important to select the right RAID controller. RAID types supported, size of controller cache, read/ write policies etc. are some of the major parameters that you have to consider while choosing the RAID controller card. Dell uses PERC (PowerEdge RAID Controller). For example, you can select PERC H730P which has 2 GB cache memory and a BBU and supports RAID levels 0,1,5,6,10,50 and 60. H710P also supports 4 KB block size disk drives. For more info please have a look at my article RAID configuration using PERC.

  3. Always use and follow HCL (Hardware Compatibility List)
  4. Configure out-of-band management. Dell uses iDRAC which helps you to manage your server remotely
  5. Update BIOS, firmware and drivers to the latest and greatest version
  6. Make sure you install all the necessary Windows updates
  7. Partition style, file system and AUS (Allocation Unit Size) of the drive where VM files will be saved

    Say, you are going to save all the VM files in drive D. While creating this drive select GPT partition style. If you are running Hyper-V 2012 R2, then use NTFS file system with AUS 64 KB. If you are having Hyper-V 2016, then use ReFS with 4 KB AUS. Please refer this MSFT article for more info.

  8. Always create a NIC team and select right teaming modes

    The most widely used teaming mode is switch independent + dynamic load balancing as it is the least complicated in terms of configuration and has no dependency on your switches. But if your switches support VLT (for Dell) or vPC (for Cisco) technology then the best teaming mode will be LACP + dynamic load balancing which provides you redundancy as well as aggregated throughput of all the active links in the team.

  9. Use separate VLANs for different types of traffic

    It is recommended to use separate VLANs for management, VM traffic, iSCSI, live migration and iDRAC.

  10. If using converged networking assign proper minimum bandwidths. Reference article for QoS recommendations linked here.
  11. Use minimum number of vSwithes
  12. Configure MPIO if adding additional storage from a SAN
  13. Set jumbo frames for iSCSI interfaces 
  14. Disable NetBIOS over TCP/ IP and DNS registration on iSCSI NICs

    Please check my post: Best practice recommendations for iSCSI network adapters

  15. Enable shared nothing live migration. For more info please check my previous post 
  16. If using 10G NICs make use of VMQ

    Please have a look at this MSFT article which provides you tips on VMQ CPU assignment

  17. Add exclusions for VHD/ VHDX files from scanning if antivirus is installed
  18. Run necessary stress tests to benchmark the system

    Benchmarking helps to get an overview of the IOPS numbers in the best/ worst case scenarios, so that you can provision your workload accordingly avoiding IO congestion at storage level. You can use synthetic benchmarking tools like iometer, diskspd etc. for conducting stress tests. Also go through my article:  How to calculate total IOPS supported by a disk array. But please note that these calculations doesn't take in to account on the effect of controller cache. That means the actual IOPS values while benchmarking the system will be higher than that of the values you got from the formula which is because of the effect of cache. When you select a write-back policy, all write IOs will land directly on the controller cache and will be acknowledged. Later those will be flushed to the disk array. Larger the cache size higher the IO performance. This shows the importance of choosing the right RAID controller.

  19. Choose OS power plan High Performance
  20. Make sure PSRemoting is enabled
  21. Enable proper monitoring either using a monitoring tool or custom scripts
  22. As a DR plan you can consider using Hyper-V replica
  23. Enable RDP
  24. I strongly recommend to create a diagram to visualize connectivity of the host to your network
  25. Organize VM files and folders properly as shown below
Here all VMs are stored in E:\VM folder

Virtual hard disks, VM config files, Snapshot files etc. of each VM is organized in a proper folder structure

I hope this will be helpful if you are totally new to Hyper-V and please feel free to let me know if you have any other best practice suggestions which I missed to mention here. Cheers!

Friday, June 30, 2017

Some of the coolest features/ enhancements in Hyper-V 2016

VM compute resiliency: This will help providing resiliency to transient issues like a temporary disconnection of a cluster node due to some network issues or if the cluster service itself on the node crashes etc. The VMs will still continue working "Unmonitored" even if the node falls out of cluster membership into an isolated state. Here the unmonitored state of the VM implies that it is no longer monitored by cluster service. The default resiliency period is 4 minutes. This means the Unmonitored VMs will be allowed to run on that isolated node for 4 minutes and after that VMs will be failed over to a suitable node/ nodes in the cluster. And that particular node which is isolated is moved to a down state. The cluster service itself is now not a necessary dependency for a VM to run. As long as connectivity exists the VM will continue working.

Node quarantine: If a cluster node is isolated certain number of times (default is 3) within an hour it will be moved to quarantine state and the VMs running on it (if any) will be failed over to another suitable node/ nodes in the cluster. 

Event 1 - cluster service stopped on node A - node A isolated (down) - cluster service restarted - node A online
Event 2 - cluster service stopped on node A - node A isolated (down) - cluster service restarted - node A online
Event 3 - cluster service stopped on node A - node A down - node A quarantined

The node will be quarantined for a period of 2 hours by default. But the administrator can manually start the cluster service on that node to join it back to the cluster.

VM storage resiliency: If there is a storage interruption, the VM identifies it and it will pause all the IO's for a certain duration and once the storage is available all IO operations will be resumed. This is very helpful in case of transient storage issues, saving the VM from blue screening or crashing. If the storage path is not back online after a certain period of time, it will pause the VM. Once storage comes back it auto resumes.

VM memory run time resize: You can now increase/ decrease RAM of a running VM.

Hot add/ remove VM network adapters: VM network adapters can also be added or removed on the fly.

Cluster OS rolling upgrades: With this feature you can upgrade your Hyper-V 2012 R2 cluster to Hyper-V 2016 cluster without shutting down the cluster. You can upgrade your existing cluster in 2 ways. Either you can add new 2016 nodes to the 2012 R2 cluster, migrate workload to new 2016 nodes and evict old nodes. Or you can evict one of the existing 2012 R2 node, do a clean installation of 2016, add it back to the cluster and do the same for rest of the nodes. Once all the nodes are 2016, you can update cluster functional level to 2016.

Thursday, May 11, 2017

Benchmarking Hyper-Converged Storage Spaces Direct (S2D) Cluster

Finally I managed to write some PowerShell code as I am completely inspired by my new PS geek friends. The scripts can be used to generate load and stress test your S2D as well as traditional Hyper-V 2016 cluster. These are functionally similar to VM Fleet. There are 7 scripts in total.
  1. create_clustered_testvms.ps1 : this script creates virtual machines on the cluster nodes which will be used for stress testing
  2. start_all_testvms.ps1 : start all those clustered VMs that you just created
  3. io_stress_trigger.ps1 : to trigger IO stress on all VMs using diskspd 
  4. rebalance_all_testvms.ps1 : this script is originally from winblog, I just made a small change so that it will use live migration while moving the clustered VMs back to their owner node
  5. watch_iops_live.ps1 : to view read, write and total iops of each CSV disk on the S2D cluster 
  6. stop_all_testvms.ps1 : to shutdown all the clustered VMs
  7. wipeoff_testvms.ps1 : to delete all VMs that you created using the first script
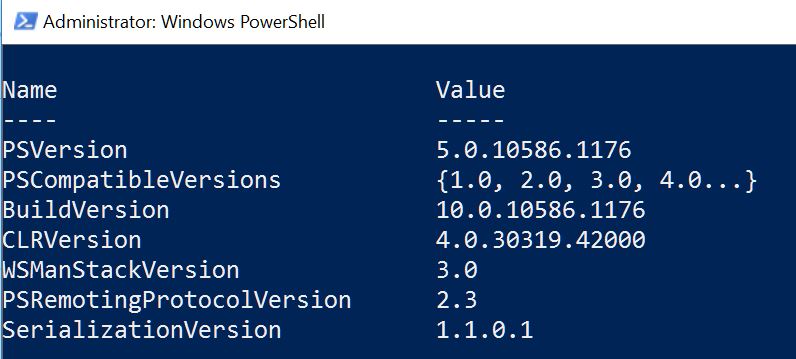
PS Version which I am using is given below.


Now I will explain briefly about how to use these scripts and a few prerequisites. Say, you have a 4 node hyper-converged S2D cluster.


As there are 4 nodes , you should have 4 cluster shared volumes (CSV). Assign one CSV to each cluster node as shown below. This means when you create VMs on NODE-01, it will be placed on CSV Volume AA, for NODE-02 VMs will be placed on Volume BB and so on. 


Volume AA is C:\ClusterStorage\Volume1


Similarly,
Volume BB is C:\ClusterStorage\Volume2
Volume CC is C:\ClusterStorage\Volume3
Volume DD is C:\ClusterStorage\Volume4


Your cluster shared volumes are ready now. Create 2 folders inside Volume1 as shown below.


Copy all the 7 PS scripts to scripts folder. Code of each script is given at the end.


You now need a template VHDX and that needs to be copied to template folder.
Note: It should be named as "template"


This template is nothing but a Windows Server 2016 VM created on a dynamically expanding disk. So you just have to create a VM with dynamically expanding VHDX, install Windows Server 2016 and set local administrator password to "Pass1234". Download diskspd from Microsoft, unzip it and just copy the diskspd.exe to C drive of the VM you just created.


Shutdown the VM. No need to sysprep it. Copy the VHDX disk of the VM to template folder and rename it to "template". The disk will be around 9.5 GB in size. Once the template is copied, you are all set to start. 

Step 1: 
Run create_clustered_testvms.ps1 
This will create clustered testvms on each of the nodes. It will be done in such a way that VMs on NODE-01 will be stored on Volume1, VMs on NODE-02 will be stored on Volume2 and so on 

Step 2:
Run start_all_testvms.ps1 
This will start all the testvms

Step 3:
Wait for a few seconds to ensure all the testvms are booted properly; then run io_stress_trigger.ps1 and provide necessary input parameters 


Step 4:
You can watch IOPS of the cluster using watch_iops_live.ps1


If you would like to live migrate some testvms while the stress test is running you can try it and observe the IO variations. But before running the io_stress_trigger.ps1 again you have to move/ migrate all those testvms back to their preferred owners. This can be done using rebalance_all_testvms.ps1 .  

If any testvms are not running on their preferred owner, then io_stress_trigger.ps1 will fail for those VMs. Here, testvms running on NODE-01 has preferred owner NODE-01, similarly for all other testvms. So you have to make sure all the testvms are running on their preferred owner before starting io stress script.

Use stop_all_testvms.ps1 to shutdown all the clustered testvms that you created on step 1. To delete all the testvms, you can use wipeoff_testvms.ps1 .

NOTE: While running scripts 2,3,6 and 7 please make sure all the testvms are running on their preferred owner. Use rebalance_all_testvms.ps1 to assign all testvms back to its preferred owner! Also please run all these scripts on PowerShell with elevated privileges after directly logging into any of the cluster nodes.

All codes given below. It might not be optimal but I am pretty sure it works! Cheers !
--------------------------------------------------------------------------------------------------------------------------

#BEGIN_create_clustered_testvms.ps1
#Get cluster info
$Cluster_name = (Get-Cluster).name
$Nodes_name = (Get-ClusterNode).name
$Node_count = (Get-ClusterNode).count

#Input VM config
$VM_count = Read-Host "Enter number of VMs/ node"
$Cluster_VM_count = $VM_count*$Node_count
[int64]$RAM = Read-Host "Enter memory for each VM in MB Eg: 4096"
$RAM = 1MB*$RAM
$CPU = Read-Host "Enter CPU for each VM"

#Creds to Enter-PSSession
$pass = convertto-securestring -asplaintext -force -string Pass1234
$cred = new-object -typename system.management.automation.pscredential -argumentlist "administrator", $pass

#Loop for each node in cluster
for($i=1; $i -le $Node_count; $i++){
    $VM_path = "C:\ClusterStorage\Volume$i"
    $Node = $Nodes_name[$i-1]

    #Remote session to each node
    $S1 = New-PSSession -ComputerName $Node -Credential $cred

    #Loop for creating new testvms on each node
    for($j=1; $j -le $VM_count; $j++){
        $VM_name = "testvm-$Node-$j"
        new-vm -name $VM_name -computername $Node -memorystartupbytes $RAM -generation 2 -Path $VM_path
        set-vm -name $VM_name -ProcessorCount $CPU -ComputerName $Node
        New-Item -path $VM_path\$VM_name -name "Virtual Hard Disks" -type directory

        #Copy template disk
        Copy-Item "C:\ClusterStorage\Volume1\template\template.vhdx" -Destination "$VM_path\$VM_name\Virtual Hard Disks" -Verbose
        Add-VMHardDiskDrive -VMName $VM_name -ComputerName $Node -path "$VM_path\$VM_name\Virtual Hard Disks\template.vhdx" -Verbose

        #Create new fixed test disk
        New-VHD -Path "$VM_path\$VM_name\Virtual Hard Disks\test_disk.vhdx" -Fixed -SizeBytes 40GB
        Add-VMHardDiskDrive -VMName $VM_name -ComputerName $Node -path "$VM_path\$VM_name\Virtual Hard Disks\test_disk.vhdx" -Verbose

        Get-VM -ComputerName $Node -VMName $VM_name | Start-VM
        Add-ClusterVirtualMachineRole -VirtualMachine $VM_name
        Set-ClusterOwnerNode -Group $VM_name -owner $Node
        Start-Sleep -S 10

        #Remote session to each testvm on the node to initialize and format test disk (drive D:)
        Invoke-Command -Session $S1 -ScriptBlock {param($VM_name2,$cred2) Invoke-Command -VMName $VM_name2 -Credential $cred2 -ScriptBlock {
            Initialize-Disk -Number 1 -PartitionStyle MBR
            New-Partition -DiskNumber 1 -UseMaximumSize -DriveLetter D
            Get-Volume | where DriveLetter -eq D | Format-Volume -FileSystem NTFS -NewFileSystemLabel Test_disk -confirm:$false
            }} -ArgumentList $VM_name,$cred

        Start-Sleep -S 5
        Get-VM -ComputerName $Node -VMName $VM_name | Stop-VM -Force
        }
    }
#END_create_clustered_testvms.ps1


--------------------------------------------------------------------------------------------------------------------------

#BEGIN_start_all_testvms.ps1
#Get cluster info
$Cluster_name = (Get-Cluster).name
$Nodes_name = (Get-ClusterNode).name
$Node_count = (Get-ClusterNode).count

for($i=1; $i -le $Node_count; $i++){
    $Node = $Nodes_name[$i-1]
    Get-VM -ComputerName $Node -VMName "testvm-$Node*" | Start-VM -AsJob

    }
#END_start_all_testvms.ps1


--------------------------------------------------------------------------------------------------------------------------

#BEGIN_io_stress_trigger.ps1
#Get cluster info
$Cluster_name = (Get-Cluster).name
$Nodes_name = (Get-ClusterNode).name
$Node_count = (Get-ClusterNode).count

#Creds to Enter-PSSession
$pass = convertto-securestring -asplaintext -force -string Pass1234
$cred = new-object -typename system.management.automation.pscredential -argumentlist "administrator", $pass

$time = Read-Host "Enter duration of stress in seconds (Eg: 300)"
$block_size = Read-Host "Enter block size (Eg: 4K)"
$writes = Read-Host "Enter write percentage (Eg: 20)"
$OIO = Read-Host "Enter number of outstanding IOs (Eg: 16)"
$threads = Read-Host "Enter number of threads (Eg: 2)"

#Loop for each node in cluster
for($i=1; $i -le $Node_count; $i++){
    $VM_path = "C:\ClusterStorage\Volume$i"
    $Node = $Nodes_name[$i-1]

    #Remote session to each node
    $S1 = New-PSSession -ComputerName $Node -Credential $cred

    $VM_count = (Get-VM -ComputerName $Node -VMName "testvm-$Node*").Count

    #Loop for creating new testvms on each node
    for($j=1; $j -le $VM_count; $j++){
        $VM_name = "testvm-$Node-$j"

        #Remote session to each testvm
        Invoke-Command -Session $S1 -ScriptBlock {param($VM_name2,$cred2,$time1,$block_size1,$writes1,$OIO1,$threads1) Invoke-Command -VMName $VM_name2 -Credential $cred2 -ScriptBlock {param($time2,$block_size2,$writes2,$OIO2,$threads2)
        C:\diskspd.exe -"b$block_size2" -"d$time2" -"t$threads2" -"o$OIO2" -h -r -"w$writes2" -L -Z500M -c38G D:\io_stress.dat
        } -AsJob -ArgumentList $time1,$block_size1,$writes1,$OIO1,$threads1 } -ArgumentList $VM_name,$cred,$time,$block_size,$writes,$OIO,$threads


        }
    }
#END_io_stress_trigger.ps1


--------------------------------------------------------------------------------------------------------------------------

#BEGIN_rebalance_all_testvms.ps1
$clustergroups = Get-ClusterGroup | Where-Object {$_.IsCoreGroup -eq $false}
 foreach ($cg in $clustergroups)
 {
     $CGName = $cg.Name
     Write-Host "`nWorking on $CGName"
     $CurrentOwner = $cg.OwnerNode.Name
     $POCount = (($cg | Get-ClusterOwnerNode).OwnerNodes).Count
     if ($POCount -eq 0)
     {
         Write-Host "Info: $CGName doesn't have a preferred owner!" -ForegroundColor Magenta
     }
     else
     {
         $PreferredOwner = ($cg | Get-ClusterOwnerNode).Ownernodes[0].Name
         if ($CurrentOwner -ne $PreferredOwner)
         {
             Write-Host "Moving resource to $PreferredOwner, please wait..."
             $cg | Move-ClusterVirtualMachineRole -MigrationType Live -Node $PreferredOwner
         }
         else
         {
             write-host "Resource is already on preferred owner! ($PreferredOwner)"
         }
     }
 }
 Write-Host "`n`nFinished. Current distribution: "

 Get-ClusterGroup | Where-Object {$_.IsCoreGroup -eq $false} 
#END_rebalance_all_testvms.ps1


--------------------------------------------------------------------------------------------------------------------------

#BEGIN_watch_iops_live.ps1
#Get cluster info
$Cluster_name = (Get-Cluster).name
$Nodes_name = (Get-ClusterNode).name

while($true)
{

    [int]$total_IO = 0
    [int]$total_readIO = 0
    [int]$total_writeIO = 0
 
    clear
     
    "{0,-15} {1,-15} {2,-15} {3,-15} {4, -15} {5, -15}" -f "Host", "Total IOPS", "Reads/Sec", "Writes/Sec", "Read Q Length", "Write Q Length"

    for($j=1; $j -le $Nodes_name.count; $j++){

        $Node = $Nodes_name[$j-1]

        $Data = Get-CimInstance -ClassName Win32_PerfFormattedData_CsvFsPerfProvider_ClusterCSVFS -ComputerName $Node | Where Name -like Volume$j

        [int]$T = $Data.ReadsPerSec+$Data.WritesPerSec
     
        "{0,-15} {1,-15} {2,-15} {3,-15} {4,-15} {5, -15}" -f "$Node", "$T", $Data.ReadsPerSec, $Data.WritesPerSec, $Data.CurrentReadQueueLength, $Data.CurrentWriteQueueLength

        $total_IO = $total_IO+$T
        $total_readIO = $total_readIO+$Data.ReadsPerSec
        $total_writeIO = $total_writeIO+$Data.WritesPerSec
        }

    echo `n
    "{0,-15} {1,-15} {2,-15} {3,-15} " -f "Cluster IOPS", "$total_IO", "$total_readIO", "$total_writeIO"

    Start-Sleep -Seconds 3

}
#END_watch_iops_live.ps1

--------------------------------------------------------------------------------------------------------------------------

#BEGIN_stop_all_testvms.ps1
#Get cluster info
$Cluster_name = (Get-Cluster).name
$Nodes_name = (Get-ClusterNode).name
$Node_count = (Get-ClusterNode).count

for($i=1; $i -le $Node_count; $i++){
    $Node = $Nodes_name[$i-1]
    Get-VM -ComputerName $Node -VMName "testvm-$Node*" | Stop-VM -Force -AsJob
    }
#END_stop_all_testvms.ps1

--------------------------------------------------------------------------------------------------------------------------

#BEGIN_wipeoff_testvms.ps1
#Get cluster info
$Cluster_name = (Get-Cluster).name
$Nodes_name = (Get-ClusterNode).name
$Node_count = (Get-ClusterNode).count

#Loop for each node in cluster
for($i=1; $i -le $Node_count; $i++){
    $VM_path = "C:\ClusterStorage\Volume$i"
    $Node = $Nodes_name[$i-1]

    $VM_count = (get-vm -ComputerName $Node -Name "testvm-$Node-*").Count

    #Loop to delete testvm on each node
    for($j=1; $j -le $VM_count; $j++){

        $VM_name = "testvm-$Node-$j"
        $full_path = "$VM_path\$VM_name"

        Get-VM -Computername $Node -VMname $VM_name | stop-vm -force
        Get-ClusterGroup $VM_name | Remove-ClusterGroup -Force -RemoveResources
        Get-VM -Computername $Node -VMname $VM_name | remove-vm -force
        Remove-Item $full_path -Force -Recurse -ErrorAction SilentlyContinue -Verbose
        }

    }
#END_wipeoff_testvms.ps1

--------------------------------------------------------------------------------------------------------------------------


Friday, April 28, 2017

Storage Spaces Direct - Volumes and Resiliency

Storage Spaces Direct (S2D) is the Microsoft implementation of software defined storage (SDS). This article briefly explains about the different types of volumes that can be created on a S2D cluster. Once you enable S2D using Enable-ClusterS2D cmdlet, it will automatically claim all physical disks in the cluster and forms a storage pool. On top of this pool you can create multiple volumes which is explained below.

Mirror
  • Recommended for workloads that have strict latency requirements or that need lots of mixed random IOPS
  • Eg: SQL Server databases or performance-sensitive Hyper-V VMs
  • If you have a 2 node cluster: Storage Spaces Direct will automatically use two-way mirroring for resiliency
  • If your cluster has 3 nodes: it will automatically use three-way mirroring
  • Three-way mirror can sustain two fault domain failures at same time
new-volume -friendlyname "Volume A" -filesystem CSVFS_ReFS -storagepoolfriendlyname S* -size 1TB
  • You can create two-way mirror by mentioning "PhysicalDiskRedundancy 1"
new-volume -friendlyname "Volume A" -filesystem CSVFS_ReFS -storagepoolfriendlyname S* -size 1TB -PhysicalDiskRedundancy 1

Parity
  • Recommended for workloads that write less frequently, such as data warehouses or "cold" storage, traditional file servers, VDI etc.
  • For creating dual parity volumes min 4 nodes are required and can sustain two fault domain failures at same time
new-volume -friendlyname "Volume B" -filesystem CSVFS_ReFS -storagepoolfriendlyname S* -size 1TB -resiliencysettingname Parity
  • You can create single parity volumes using the below
new-volume -friendlyname "Volume B" -filesystem CSVFS_ReFS -storagepoolfriendlyname S* -size 1TB -resiliencysettingname Parity -PhysicalDiskRedundancy 1

Mixed/ Tiered / Multi-Resilient (MRV)
  • In Windows Server 2012 R2 Storage Spaces, when you create storage tiers you dedicated physical media devices. That means SSD for performance tier and HDD for capacity tier
  • But in Windows Server 2016, tiers are differentiated not only by media types; it can include resiliency types too
  • MRV = Three-way mirror + dual-parity
  • In a MRV, three-way mirror portion is considered as performance tier and dual parity portion as capacity tier
  • Recommended for workloads that write in large, sequential, such as archival or backup targets
  • Writes land to mirror section of the volume and then it is gradually moved/ rotated in to parity portion later
  • Each MRV by default will have 32 MB Write-back cache 
  • ReFS starts rotating data into the parity portion at 60% utilization of the mirror portion and gradually as utilization increases the speed of data movement to parity portion also increases
  • You should have min 4 nodes to create a MRV
new-volume -friendlyname "Volume C" -filesystem CSVFS_ReFS -storagepoolfriendlyname S* -storagetierfriendlynames Performance, Capacity -storagetiersizes 1TB, 9TB

References: