Sunday, June 27, 2021

vSphere with Tanzu using NSX-T - Part9 - Monitoring

In the previous posts we discussed the following:

Part1 - Prerequisites

Part2 - Configure NSX

Part3 - Edge Cluster

Part4 - Tier-0 Gateway and BGP peering

Part5 - Tier-1 Gateway and Segments

Part6 - Create tags, storage policy, and content library

Part7 - Enable workload management


In this article, I will explain some of the popular tools used for monitoring Kubernetes clusters that provides insight into different objects in K8s, status, metrics, logs, and so on.

  • Lens
  • Octant
  • Prometheus and Grafana
  • vROps and Kubernetes Management Pack
  • Kubebox


-Lens-

Download the Lens binary file from: https://k8slens.dev/


I am installing it on a Windows server. Once the installation is complete, the first thing you have to do is to provide the Kube config file details so that Lens can connect to the Kubernetes cluster and start monitoring it.

Add Cluster

Click File - Add Cluster


You can either browse and select the Kube config file or you can paste the content of your Kube config file as text. I am just pasting it as text.


Once you have pasted your Kube config file contents, make sure to select the context, and then click Add cluster.


Deploy Prometheus stack

If you aren't seeing CPU and memory metrics, you will need to install the Prometheus stack on your K8s cluster. And Lens has a feature that deploys the Prometheus stack on your K8s cluster with the click of a button!

Select the cluster icon and click Settings.


Scroll all the way to the end, and under Features, you will find an Install button. In my case, I've already installed it, that's why it's showing the Uninstall button.


Once you click the Install button, Lens will go ahead and install the Prometheus stack on the selected K8s cluster. After few minutes, you should be able to see all the metrics.

You can see a namespace called "lens-metrics" and under that, the Prometheus stack components are deployed.


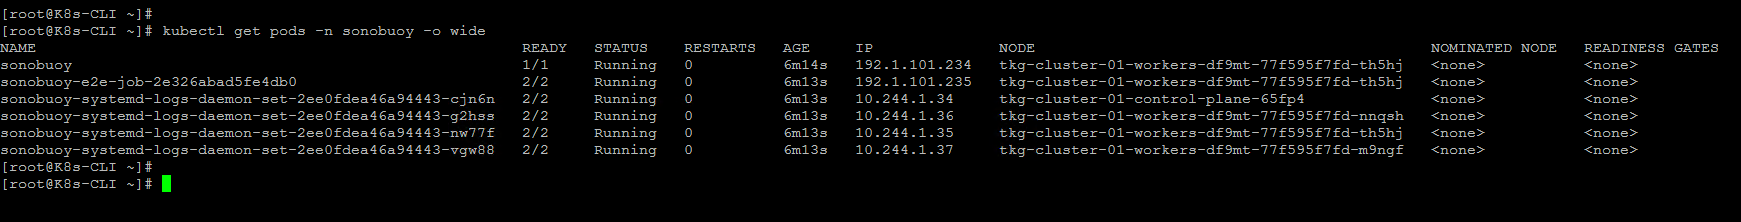
Following are the service objects that are created as part of the Prometheus stack deployment.


And, here is the PVC that is attached to the Prometheus pod.


Terminal access

Click on Terminal to get access directly to the K8s cluster.


Pod metrics, SSH to the pod, and container logs


Scaling
 
Note: In a production environment, it is always a best practice to apply configuration changes to your K8s cluster objects through a version control system.


You can also see the Service Accounts, Roles, Role Bindings, and PSPs under the Access Control tab. For more details see https://docs.k8slens.dev/main/.


-Octant-

https://vineethac.blogspot.com/2020/08/visualize-your-kubernetes-clusters-and.html


-Prometheus and Grafana-


-vROps and Kubernetes Management Pack-

https://blogs.vmware.com/management/2020/12/announcing-the-vrealize-operations-management-pack-for-kubernetes-1-5-1.html

https://rudimartinsen.com/2021/03/07/vrops-kubernetes-mgmt-pack/

https://www.brockpeterson.com/post/vrops-management-pack-for-kubernetes


-Kubebox-


curl -Lo kubebox https://github.com/astefanutti/kubebox/releases/download/v0.9.0/kubebox-linux && chmod +x kubebox


Select namespace


Select Pod

This will show the selected pod metrics and logs.


Note: Kubebox relies on cAdvisor to retrieve the resource usage metrics. It’s recommended to use the provided cadvisor.yaml file, that’s tested to work with Kubebox. 

kubectl apply -f https://raw.github.com/astefanutti/kubebox/master/cadvisor.yaml

Kubebox: https://github.com/astefanutti/kubebox

Hope it was useful. Cheers!

Monday, June 21, 2021

Validate your Kubernetes cluster using Sonobuoy

Sonobuoy is a diagnostic tool that helps to validate the state of a Kubernetes cluster by running a set of tests in an accessible and non-destructive manner. By default, Sonobuoy runs the Kubernetes conformance tests. The conformance testing ensures that a cluster is properly configured and that its behavior conforms to official Kubernetes specifications. It also helps ensure that a Kubernetes cluster meets the minimal set of features. They are a subset of end-to-end (e2e) tests that should pass on any Kubernetes cluster. 

A conformance-passing cluster provides the guarantee that your Kubernetes is properly configured as per best practices. There are around 275 tests that need to be passed for qualifying Kubernetes conformance.

Install Sonobuoy

wget https://github.com/vmware-tanzu/sonobuoy/releases/download/v0.51.0/sonobuoy_0.51.0_linux_amd64.tar.gz
tar -xvf sonobuoy_0.51.0_linux_amd64.tar.gz

Note: I am installing Sonobuoy on CentOS Linux release 7.9.2009 (Core).


Help
/root/sonobuoy --help

Run Sonobuoy
/root/sonobuoy run --wait

Note: e2e test takes around 60-90 minutes to complete.


Sonobuoy Objects
kubectl get all -n sonobuoy


kubectl get pods -n sonobuoy -o wide


Sonobuoy Status
/root/sonobuoy status
/root/sonobuoy status --json
/root/sonobuoy status --json | jq

Note: If you are getting this while using jq "bash: jq: command not found..." , follow this blog to install jq.


Inspect Logs
/root/sonobuoy logs

Sonobuoy Results
results=$(/root/sonobuoy retrieve)


/root/sonobuoy results $results
/root/sonobuoy results <tar ball file>


See passed/ failed tests
/root/sonobuoy results <tar ball file> --mode=detailed | jq 'select(.status=="passed")' /root/sonobuoy results <tar ball file> --mode=detailed | jq 'select(.status=="failed")'


List the conformance tests
/root/sonobuoy results <tar ball file> --mode=detailed| jq 'select(.name | contains("[Conformance]"))'

Cleanup
/root/sonobuoy delete --wait


References

https://github.com/vmware-tanzu/sonobuoy
https://sonobuoy.io/docs/v0.51.0/


Friday, June 11, 2021

Index

Generative AI and LLMs


Kubernetes


vRealize Operations (vROps)


PowerShell