Showing posts with label observability. Show all posts

Sunday, December 3, 2023

Kubernetes mini project

In this mini project, we are going to learn the following:

  • Deploy a simple Python based web application on a Kubernetes cluster.
  • We will use Helm to deploy this app.
  • This web app uses FastAPI and exposes some metrics using the Prometheus Python client.
  • To store and visualize these metrics we will deploy Prometheus and Grafana in the K8s cluster.
  • We will also deploy and use an ingress controller for exposing the web app, Prometheus, and Grafana to external users.
  • For logging we will deploy and use Grafana Loki stack.


Full project in my GitHub

High-level steps to complete this project

Step1: Write the Python app.

Step2: Create the Dockerfile for the app.

Step3: Create the container image.

Step4: Push the container image to an image registry like Docker Hub.

Step5: Get access to a K8s cluster.

Step6: Deploy an ingress controller.

Step7: Create the Helm chart for your app and deploy it to the K8s cluster.

Step8: Deploy Prometheus stack on the K8s cluster using Helm.

Step9: Create a servicemonitor resource which defines the target to be monitored by Prometheus.

Step10: Verify targets and service discovery in Prometheus.

Step11: Configure Grafana dashboard and verify.

Step12. Deploy Grafana Loki stack using Helm.


Hope it was useful. Cheers!

Saturday, November 18, 2023

vSphere with Tanzu using NSX-T - Part29 - Logging using Loki stack

Grafana Loki is a log aggregation system that we can use for Kubernetes. In this post we will deploy Loki stack on a Tanzu Kubernetes cluster.

❯ KUBECONFIG=gc.kubeconfig kg no
NAME                                            STATUS   ROLES                  AGE    VERSION
tkc01-control-plane-k8fzb                       Ready    control-plane,master   144m   v1.23.8+vmware.3
tkc01-worker-nodepool-a1-pqq7j-76d555c9-4n5kh   Ready    <none>                 132m   v1.23.8+vmware.3
tkc01-worker-nodepool-a1-pqq7j-76d555c9-8pcc6   Ready    <none>                 128m   v1.23.8+vmware.3
tkc01-worker-nodepool-a1-pqq7j-76d555c9-rx7jf   Ready    <none>                 134m   v1.23.8+vmware.3
❯
❯ helm repo add grafana https://grafana.github.io/helm-charts
❯ helm repo update
❯ helm repo list
❯ helm search repo loki

I saved the values file using helm show values grafana/loki-stack and made necessary modifications as mentioned below. 

  • I enabled Grafana by setting enabled: true. This will create a new Grafana instance.
  • I also added a section under grafana.ingress in the loki-stack/values.yaml, that will create an ingress resource for this new Grafana instance.

 Here is the values.yaml file.

test_pod:
  enabled: true
  image: bats/bats:1.8.2
  pullPolicy: IfNotPresent

loki:
  enabled: true
  isDefault: true
  url: http://{{(include "loki.serviceName" .)}}:{{ .Values.loki.service.port }}
  readinessProbe:
    httpGet:
      path: /ready
      port: http-metrics
    initialDelaySeconds: 45
  livenessProbe:
    httpGet:
      path: /ready
      port: http-metrics
    initialDelaySeconds: 45
  datasource:
    jsonData: "{}"
    uid: ""


promtail:
  enabled: true
  config:
    logLevel: info
    serverPort: 3101
    clients:
      - url: http://{{ .Release.Name }}:3100/loki/api/v1/push

fluent-bit:
  enabled: false

grafana:
  enabled: true
  sidecar:
    datasources:
      label: ""
      labelValue: ""
      enabled: true
      maxLines: 1000
  image:
    tag: 8.3.5
  ingress:
    ## If true, Grafana Ingress will be created
    ##
    enabled: true

    ## IngressClassName for Grafana Ingress.
    ## Should be provided if Ingress is enable.
    ##
    ingressClassName: nginx

    ## Annotations for Grafana Ingress
    ##
    annotations: {}
      # kubernetes.io/ingress.class: nginx
      # kubernetes.io/tls-acme: "true"

    ## Labels to be added to the Ingress
    ##
    labels: {}

    ## Hostnames.
    ## Must be provided if Ingress is enable.
    ##
    # hosts:
    #   - grafana.domain.com
    hosts:
      - grafana-loki-vineethac-poc.test.com

    ## Path for grafana ingress
    path: /

    ## TLS configuration for grafana Ingress
    ## Secret must be manually created in the namespace
    ##
    tls: []
    # - secretName: grafana-general-tls
    #   hosts:
    #   - grafana.example.com

prometheus:
  enabled: false
  isDefault: false
  url: http://{{ include "prometheus.fullname" .}}:{{ .Values.prometheus.server.service.servicePort }}{{ .Values.prometheus.server.prefixURL }}
  datasource:
    jsonData: "{}"

filebeat:
  enabled: false
  filebeatConfig:
    filebeat.yml: |
      # logging.level: debug
      filebeat.inputs:
      - type: container
        paths:
          - /var/log/containers/*.log
        processors:
        - add_kubernetes_metadata:
            host: ${NODE_NAME}
            matchers:
            - logs_path:
                logs_path: "/var/log/containers/"
      output.logstash:
        hosts: ["logstash-loki:5044"]

logstash:
  enabled: false
  image: grafana/logstash-output-loki
  imageTag: 1.0.1
  filters:
    main: |-
      filter {
        if [kubernetes] {
          mutate {
            add_field => {
              "container_name" => "%{[kubernetes][container][name]}"
              "namespace" => "%{[kubernetes][namespace]}"
              "pod" => "%{[kubernetes][pod][name]}"
            }
            replace => { "host" => "%{[kubernetes][node][name]}"}
          }
        }
        mutate {
          remove_field => ["tags"]
        }
      }
  outputs:
    main: |-
      output {
        loki {
          url => "http://loki:3100/loki/api/v1/push"
          #username => "test"
          #password => "test"
        }
        # stdout { codec => rubydebug }
      }

# proxy is currently only used by loki test pod
# Note: If http_proxy/https_proxy are set, then no_proxy should include the
# loki service name, so that tests are able to communicate with the loki
# service.
proxy:
  http_proxy: ""
  https_proxy: ""
  no_proxy: ""

Deploy using Helm

❯ helm upgrade --install --atomic loki-stack grafana/loki-stack --values values.yaml --kubeconfig=gc.kubeconfig --create-namespace --namespace=loki-stack
WARNING: Kubernetes configuration file is group-readable. This is insecure. Location: gc.kubeconfig
WARNING: Kubernetes configuration file is world-readable. This is insecure. Location: gc.kubeconfig
Release "loki-stack" does not exist. Installing it now.
W1203 13:36:48.286498   31990 warnings.go:70] policy/v1beta1 PodSecurityPolicy is deprecated in v1.21+, unavailable in v1.25+
W1203 13:36:48.592349   31990 warnings.go:70] policy/v1beta1 PodSecurityPolicy is deprecated in v1.21+, unavailable in v1.25+
W1203 13:36:55.840670   31990 warnings.go:70] policy/v1beta1 PodSecurityPolicy is deprecated in v1.21+, unavailable in v1.25+
W1203 13:36:55.849356   31990 warnings.go:70] policy/v1beta1 PodSecurityPolicy is deprecated in v1.21+, unavailable in v1.25+
NAME: loki-stack
LAST DEPLOYED: Sun Dec  3 13:36:45 2023
NAMESPACE: loki-stack
STATUS: deployed
REVISION: 1
NOTES:
The Loki stack has been deployed to your cluster. Loki can now be added as a datasource in Grafana.

See http://docs.grafana.org/features/datasources/loki/ for more detail.


Verify

❯ KUBECONFIG=gc.kubeconfig kg all -n loki-stack
NAME                                     READY   STATUS    RESTARTS   AGE
pod/loki-stack-0                         1/1     Running   0          89s
pod/loki-stack-grafana-dff58c989-jdq2l   2/2     Running   0          89s
pod/loki-stack-promtail-5xmrj            1/1     Running   0          89s
pod/loki-stack-promtail-cts5j            1/1     Running   0          89s
pod/loki-stack-promtail-frwvw            1/1     Running   0          89s
pod/loki-stack-promtail-wn4dw            1/1     Running   0          89s

NAME                            TYPE        CLUSTER-IP       EXTERNAL-IP   PORT(S)    AGE
service/loki-stack              ClusterIP   10.110.208.35    <none>        3100/TCP   90s
service/loki-stack-grafana      ClusterIP   10.104.222.214   <none>        80/TCP     90s
service/loki-stack-headless     ClusterIP   None             <none>        3100/TCP   90s
service/loki-stack-memberlist   ClusterIP   None             <none>        7946/TCP   90s

NAME                                 DESIRED   CURRENT   READY   UP-TO-DATE   AVAILABLE   NODE SELECTOR   AGE
daemonset.apps/loki-stack-promtail   4         4         4       4            4           <none>          90s

NAME                                 READY   UP-TO-DATE   AVAILABLE   AGE
deployment.apps/loki-stack-grafana   1/1     1            1           90s

NAME                                           DESIRED   CURRENT   READY   AGE
replicaset.apps/loki-stack-grafana-dff58c989   1         1         1       90s

NAME                          READY   AGE
statefulset.apps/loki-stack   1/1     91s

❯ KUBECONFIG=gc.kubeconfig kg ing -n loki-stack
NAME                 CLASS   HOSTS                                 ADDRESS        PORTS   AGE
loki-stack-grafana   nginx   grafana-loki-vineethac-poc.test.com   10.216.24.45   80      7m16s
❯

Now in my case I've an ingress controller and dns resolution in place. If you don't have those configured, you can just port forward the loki-stack-grafana service to view the Grafana dashboard.

To get the username and password you should decode the following secret:

❯ KUBECONFIG=gc.kubeconfig kg secrets -n loki-stack loki-stack-grafana -oyaml

Login to the Grafana instance and verify the Data Sources section, and it must be already configured. Now click on explore option and use the log browser to query logs. 

Hope it was useful. Cheers!

Friday, September 22, 2023

Configure syslog forwarding in vCenter servers using Python

As a system administrator, it's essential to ensure that your vCenter servers are properly configured to collect and forward system logs to a central location for monitoring and analysis. In this blog, we'll explore how to configure syslog forwarding in vCenter servers using Python.

You can access the Python script from my GitHub repository: 
https://github.com/vineethac/VMware/tree/main/vCenter/syslog_forwarding


In this blog, we've demonstrated how to get, test, and set syslog forwarding configuration in vCenter servers using Python. By following these steps, you can ensure that your vCenter servers are properly configured to collect and forward system logs to a central location for monitoring and analysis. Remember to replace the placeholders in the config file with your actual vCenter server names, syslog server IP address or hostname, port, and protocol.

Hope it was useful. Cheers!

Sunday, June 27, 2021

vSphere with Tanzu using NSX-T - Part9 - Monitoring

In the previous posts we discussed the following:

Part1 - Prerequisites

Part2 - Configure NSX

Part3 - Edge Cluster

Part4 - Tier-0 Gateway and BGP peering

Part5 - Tier-1 Gateway and Segments

Part6 - Create tags, storage policy, and content library

Part7 - Enable workload management


In this article, I will explain some of the popular tools used for monitoring Kubernetes clusters that provides insight into different objects in K8s, status, metrics, logs, and so on.

  • Lens
  • Octant
  • Prometheus and Grafana
  • vROps and Kubernetes Management Pack
  • Kubebox


-Lens-

Download the Lens binary file from: https://k8slens.dev/


I am installing it on a Windows server. Once the installation is complete, the first thing you have to do is to provide the Kube config file details so that Lens can connect to the Kubernetes cluster and start monitoring it.

Add Cluster

Click File - Add Cluster


You can either browse and select the Kube config file or you can paste the content of your Kube config file as text. I am just pasting it as text.
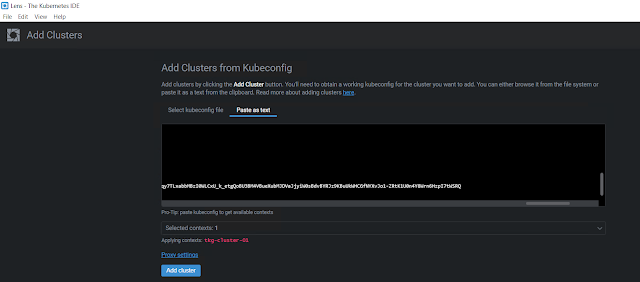
 

Once you have pasted your Kube config file contents, make sure to select the context, and then click Add cluster.


Deploy Prometheus stack

If you aren't seeing CPU and memory metrics, you will need to install the Prometheus stack on your K8s cluster. And Lens has a feature that deploys the Prometheus stack on your K8s cluster with the click of a button!

Select the cluster icon and click Settings.


Scroll all the way to the end, and under Features, you will find an Install button. In my case, I've already installed it, that's why it's showing the Uninstall button.


Once you click the Install button, Lens will go ahead and install the Prometheus stack on the selected K8s cluster. After few minutes, you should be able to see all the metrics.

You can see a namespace called "lens-metrics" and under that, the Prometheus stack components are deployed.


Following are the service objects that are created as part of the Prometheus stack deployment.


And, here is the PVC that is attached to the Prometheus pod.


Terminal access

Click on Terminal to get access directly to the K8s cluster.


Pod metrics, SSH to the pod, and container logs


Scaling
 
Note: In a production environment, it is always a best practice to apply configuration changes to your K8s cluster objects through a version control system.


You can also see the Service Accounts, Roles, Role Bindings, and PSPs under the Access Control tab. For more details see https://docs.k8slens.dev/main/.


-Octant-

https://vineethac.blogspot.com/2020/08/visualize-your-kubernetes-clusters-and.html


-Prometheus and Grafana-


-vROps and Kubernetes Management Pack-

https://blogs.vmware.com/management/2020/12/announcing-the-vrealize-operations-management-pack-for-kubernetes-1-5-1.html

https://rudimartinsen.com/2021/03/07/vrops-kubernetes-mgmt-pack/

https://www.brockpeterson.com/post/vrops-management-pack-for-kubernetes


-Kubebox-


curl -Lo kubebox https://github.com/astefanutti/kubebox/releases/download/v0.9.0/kubebox-linux && chmod +x kubebox


Select namespace


Select Pod

This will show the selected pod metrics and logs.


Note: Kubebox relies on cAdvisor to retrieve the resource usage metrics. It’s recommended to use the provided cadvisor.yaml file, that’s tested to work with Kubebox. 

kubectl apply -f https://raw.github.com/astefanutti/kubebox/master/cadvisor.yaml

Kubebox: https://github.com/astefanutti/kubebox

Hope it was useful. Cheers!