In the previous posts we discussed the following:
Part1 - Prerequisites
Part2 - Configure NSX
Part3 - Edge Cluster
Part4 - Tier-0 Gateway and BGP peering
Part5 - Tier-1 Gateway and Segments
Part6 - Create tags, storage policy, and content library
Part7 - Enable workload management
In this article, I will explain some of the popular tools used for monitoring Kubernetes clusters that provides insight into different objects in K8s, status, metrics, logs, and so on.
- Lens
- Octant
- Prometheus and Grafana
- vROps and Kubernetes Management Pack
- Kubebox
-Lens-
Download the Lens binary file from: https://k8slens.dev/
I am installing it on a Windows server. Once the installation is complete, the first thing you have to do is to provide the Kube config file details so that Lens can connect to the Kubernetes cluster and start monitoring it.
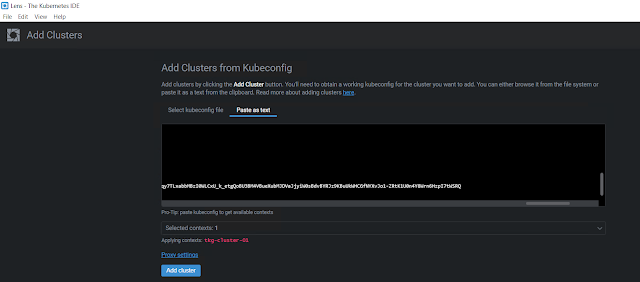
Add Cluster
Click File - Add Cluster
You can either browse and select the Kube config file or you can paste the content of your Kube config file as text. I am just pasting it as text.
Once you have pasted your Kube config file contents, make sure to select the context, and then click Add cluster.
-Octant-
https://vineethac.blogspot.com/2020/08/visualize-your-kubernetes-clusters-and.html
-Prometheus and Grafana-
-vROps and Kubernetes Management Pack-
https://rudimartinsen.com/2021/03/07/vrops-kubernetes-mgmt-pack/
https://www.brockpeterson.com/post/vrops-management-pack-for-kubernetes
-Kubebox-
curl -Lo kubebox https://github.com/astefanutti/kubebox/releases/download/v0.9.0/kubebox-linux && chmod +x kubebox
This will show the selected pod metrics and logs.


No comments:
Post a Comment