In this article, I will walk you through how to use vROps for vSAN monitoring and performance troubleshooting. It is always recommended to follow a systematic and established approach to troubleshoot problems. Before we start here is a link to one of my article which explains the scientific method of troubleshooting.
Given below are some very useful content from VMware that talks about vSAN performance troubleshooting.
Performance is all relative and sometimes performance issues can be because of the wrong perception. So it is always good to validate it with actual numbers. Compare with a benchmark value or verify all relevant metrics before and after the issue has been reported. Now assume there is a storage issue in the environment. Given below is a systematic order to approach the problem, identify it correctly, isolate it and finally take necessary steps to resolve it.
vSAN performance troubleshooting approach
Infrastructure: Perform vSAN cluster health check
Virtual machine level: Is there a storage issue observed at the application level?
Virtual machine level: Is there a storage issue per vmdk level?
Latency (vmdk)
IOPS (vmdk)
Cluster level: Look at operations overview at the cluster level
Latency
IOPS
Host level: Identify the IO type that has a performance issue
Read IO
Write IO
Host level: Collect/ analyze metrics of the storage objects
Storage adapter (vmhba)
Disk groups
Cache disk
Capacity disk
Host level: Collect/ analyze metrics of the network objects
Physical adapter (vmnic)
vSAN network (vmk)
At this point, you have a clearly defined workflow in identifying and resolving the issue. So let's have a look at the various vROps dashboards that provides you end to end visibility of your stack and helps you easily identify and isolate the issue. If there is a problem or abnormality or unusual performance behavior in your vSAN environment, vROps will notify that with alerts based on various metric values it monitors using its inbuilt intelligence and analytics capabilities. Alert generation is based on symptom and alert definitions and this will finally affect the health, risk or efficiency badge of the respective object. Status of the badges, symptoms, alerts, recommendations, historical performance data and time stamps will be very useful in the process of troubleshooting and quickly finding the actual problem.
Infrastructure: Perform vSAN cluster health check
As a starting point, you can make use of integrated health checks from vCenter to verify your vSAN infrastructure.
Virtual machine level: Is there a storage issue observed at the application level? You can make use of application aware operations feature in vROps 7.5 to get full stack visibility. Given below are the list of applications that can be currently monitored using vROps 7.5.
If your application is not supported or if application aware monitoring is not configured, then you can go with native application performance counters/ methods to identify whether the application itself is observing/ affected by storage latency, low IOPS, etc.
Virtual machine level: Is there a storage issue per vmdk level?
As a first step, you can use the "Troubleshoot a VM" dashboard to understand and track resource usage of a virtual machine.
Troubleshoot a VM - a
Troubleshoot a VM - b
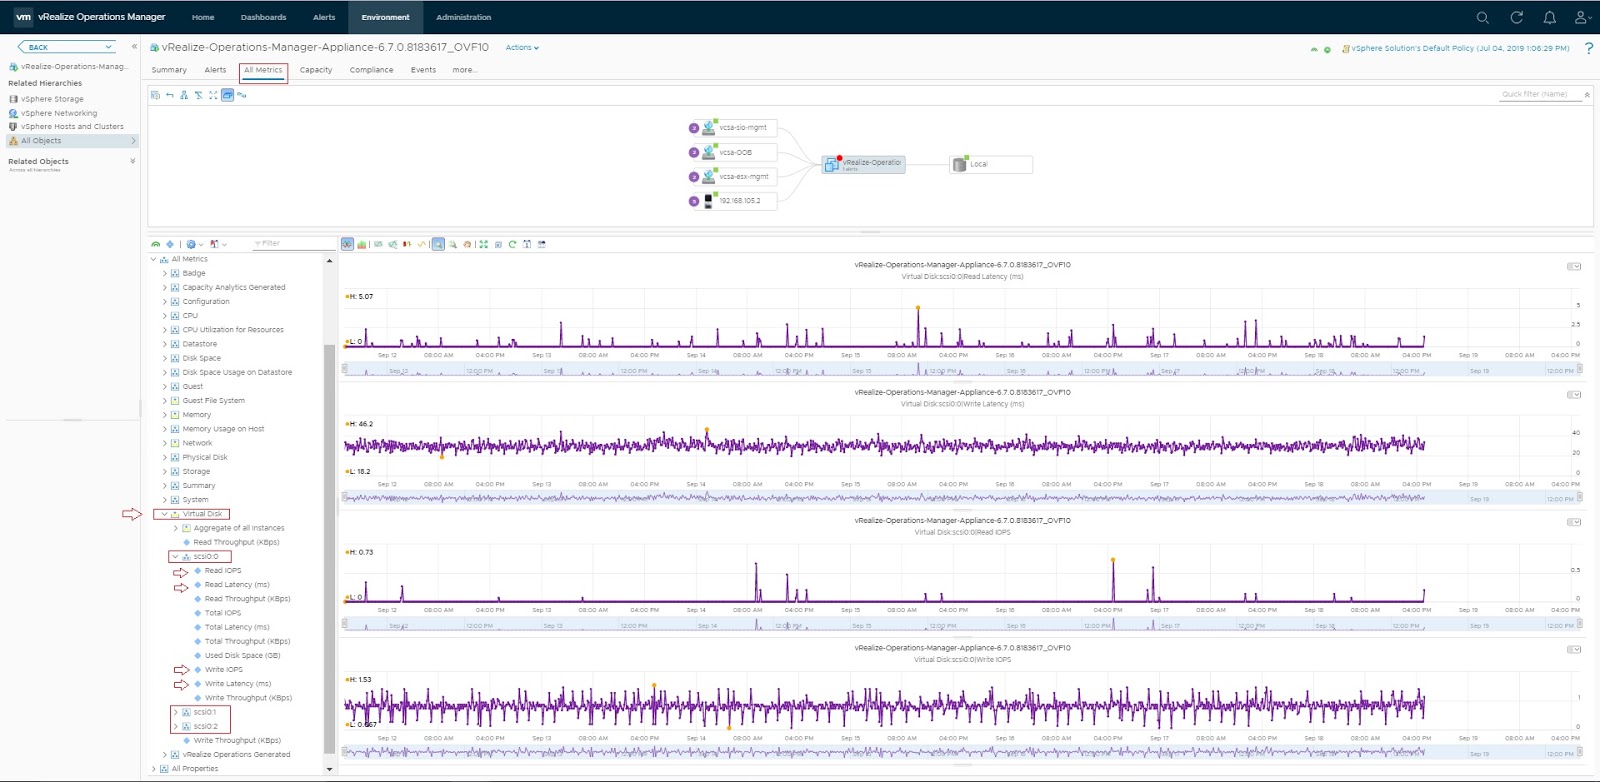
Select the VM object to get more details. Below screenshot shows metrics related to a virtual disk.
Cluster level: Look at operations overview at the cluster level
vSAN operations overview dashboard
Troubleshooting vSAN dashboard
Troubleshooting vSAN - a
Troubleshooting vSAN - b
Troubleshooting vSAN - c
Host level: Identify the IO type that has a performance issue
Host level storage metrics
Host level: Collect/ analyze metrics of the storage objects
Metrics related to a disk group
Read cache and write buffer metrics of a disk group
Performance metrics of a capacity disk
Host level: Collect/ analyze metrics of the network objects
Metrics related to vmnic (physical NIC) and vSAN vmk
Metrics related to network objects will help to determine whether the performance issue is due to resource contention, network misconfiguration, hardware issue, etc.