Showing posts with label alerts. Show all posts

Friday, January 1, 2021

Dell EMC PowerFlex MP for vROps 8.x - Part7 - Create custom reports

In March 2020, I published a blog on how to create custom views and reports in vROps 8.x. This article explains how to create a custom storage report for Dell EMC PowerFlex using the PowerFlex Management Pack for vROps 8.x. 

Sample PowerFlex Storage Report PDF and template is available in my GitHub repo for download. You can use it as a starting point/ modify it as per requirement.

To create a new view: Dashboards - Views - Add.

Provide a name and description for the new view. Here, for example, I will create a view that shows PowerFlex Protection Domain Info.


Select List.


Select Protection Domain as subject and group it by PowerFlex Rack/ Appliance System.


Double click or drag and drop the selected metrics or properties to include in the view. In the following screenshot, I selected 4 capacity metrics to include in the view.


You can also select and change the units and transformation as per requirements. Once it is done, click Save.

Now a view is created. Similarly, you can create multiple views for the different PowerFlex resource kinds. The next step is to include this view in an existing template or in a new template. 

To create a new report template: Dashboards - Reports - Add.

  • Provide a name and description for the new report template.
  • From the views and dashboards, find the PowerFlex Protection Domain Info view that we created earlier, double-click or drag and drop them to the right pane. You can add multiple views to be included in this report template.
  • Select PDF and CSV.
  • Select all the layout options if you like to and click Save.
  • Now the custom report template is created. You can select it and click Run.

Select PowerFlex and then select PowerFlex World and click ok.


The report will run in the background and will be available to download under the "Generated Reports" tab. You can select it and download the PDF or CSV file. You can even configure a schedule to generate a report and email it or save it to a location automatically based on your requirements. Hope it was useful. Cheers!

Related posts


Sunday, November 8, 2020

Dell EMC PowerFlex MP for vROps 8.x - Part4 - Resource kinds and relationships

In this post, we will take a look at the different resource kinds that are part of the Dell EMC PowerFlex Management Pack. Following is a very high-level logical representation of the PowerFlex Adapter resource kinds and their relationships:


Go to Environment - All objects - PowerFlex Adapter


You can also get a PowerFlex system level view in vROps using the PowerFlex rack/ appliance system resource kind. This system view is making use of the system name field that we provided while configuring each PowerFlex Adapter instance type. The system name is used to group all the logical components of one PowerFlex system. 


This view provides end-to-end visibility of the PowerFlex infrastructure components that will be useful to understand the relationship between different layers of the stack. This will be also helpful to identify and troubleshoot in case of issues.

Hope it was useful. Cheers!

Related posts


Part1 - Install
Part2 - Configure
Part3 - Dashboards


Wednesday, November 4, 2020

Dell EMC PowerFlex MP for vROps 8.x - Part3 - Dashboards

We have covered the installation and configuration of the PowerFlex Management Pack in the previous posts. In this post, we will have a look at the different dashboards that are part of the MP. Following are the 13 dashboards you will get after installing the MP:

Overview
  • PowerFlex System Overview
PowerFlex Manager
  • PowerFlex Manager Details
Management Controller 
  • PowerFlex Management Controller
Compute
  • PowerFlex ESXi Cluster Usage
  • PowerFlex ESXi Host Usage
  • PowerFlex SVM Utilization
Networking
  • PowerFlex Networking Environment
  • PowerFlex Networking Performance
Storage
  • PowerFlex Summary
  • PowerFlex Details
  • PowerFlex Replication Details
Server Hardware
  • PowerFlex Node Summary
  • PowerFlex Node Details

Now, let's have a quick look at some of these dashboards and their functionality.

PowerFlex Node Summary


This dashboard shows the health of all PowerFlex nodes being monitored by the MP. You can see the classification of nodes as Compute Only, Storage Only, Hyperconverged, and Management Controller along with a relationship between a node and its corresponding hardware components.


PowerFlex Summary


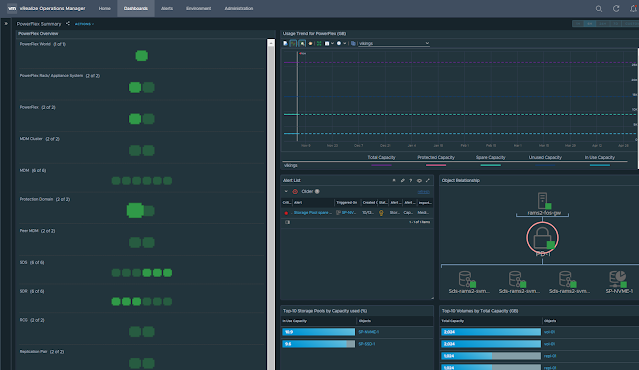
This dashboard shows the health status of all the logical components of the PowerFlex storage system. It also has a parent-child relationship between different objects of the storage system. You can also see widgets for capacity usage trend forecasting, alerts, top storage pools by capacity usage, top volumes by size, etc.


PowerFlex Details


This dashboard shows all PowerFlex storage performance KPIs like IOPS, Bandwidth, Latency, etc.


PowerFlex Networking Environment


You can see the health status of Cisco networking components and the relationship between network interfaces, nodes, switch ports, VLANs, port-channels, etc.


PowerFlex Networking Performance


This dashboard shows the switch and switch port KPIs like Throughout, Errors, Packet discards, etc.


PowerFlex Manager


You can see the service deployment details like service health, RCM compliance status, deployment status, etc. in this dashboard.


Hope it was useful. Cheers!

References


Monday, November 2, 2020

Dell EMC PowerFlex MP for vROps 8.x - Part2 - Configure

In this post, I will explain how to configure the PowerFlex Management Pack for vROps


Before getting into the configuration, I would like to provide a high-level view of my lab setup. I have two separate PowerFlex rack systems that I will be monitoring using the management pack. The two systems are named RAMS and VIKINGS and have the following components.


The PowerFlex Management Pack supports the following 4 instance types:
  • PowerFlex Networking - queries and collects networking details from Cisco switches
  • PowerFlex Gateway - queries and collects storage details from PowerFlex Gateway
  • PowerFlex Nodes - queries and collects server hardware health details from iDRACs
  • PowerFlex Manager - queries and collects service deployment details from PowerFlex Manager

Note: The default collection interval for all PowerFlex Adapter instance types is set to 5 minutes.

I have already configured the controller VCSA and customer VCSA of both (RAMS and VIKINGS) clusters as shown below. This makes use of the native vSphere Adapter and vSAN Adapter present in vROps.


Note: The PowerFlex MP is already installed in vROps. Please see the previous post on how to install it.

Now we can start adding required accounts for the PowerFlex Adapter to connect to the different REST endpoints.

PowerFlex Networking


Click add account.


Select the PowerFlex Adapter.


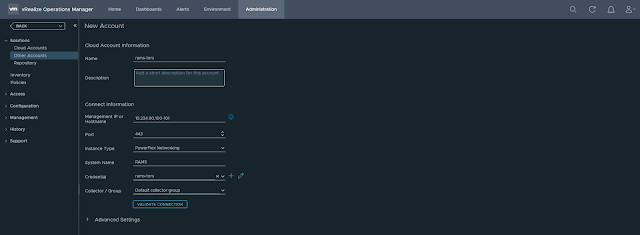
Let's configure the account for monitoring Cisco TOR switches of the RAMS cluster.

Provide the following details:

  • Name
  • Management IP address of Cisco TOR switches

Select the instance type as "PowerFlex Networking" and provide a system name. 
In this case, these TOR switches are part of RAMS. So I have given the system name as RAMS.


Add a new credential. Select the credential kind as "PowerFlex Networking Adapter Credentials". 
Provide a credential name, username and password. Click OK.


Click VALIDATE CONNECTION.


If everything is fine, you will get a test connection successful message. Click OK.


Click ADD to save the account. You will see the account we just created under the other accounts page.
Initially, the status will be warning but it will turn to OK in few seconds.


Note: In the product guide it is recommended to configure not more than 40 Cisco switches in one PowerFlex Networking instance. So, if you have 80 switches in your PowerFlex system, you will need to configure 2 PowerFlex Networking instances where each instance will connect/ query/ collect details from 40 switches.

PowerFlex Gateway


PowerFlex Nodes


Make sure to provide the PowerFlex Management Controller vCenter details in the advanced settings. If you have configured the native adapter with vCenter IP address, then you have to provide the IP address in the advanced settings. In this case, I have configured the native adapter with the vCenter hostname/ FQDN, so in the advanced settings, I have provided the same FQDN. This field will be used to identify and classify the PowerFlex Management Controller nodes.

Note: In the product guide it is recommended to configure 30 iDRACs or less in one PowerFlex Node instance. So, if you have 120 nodes in your PowerFlex system, you will need to configure 4 PowerFlex Node instances where each instance will connect/ query/ collect details from 30 iDRACs.

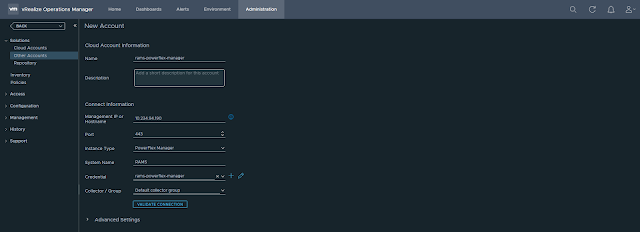
PowerFlex Manager


Note: While adding the credentials for the PowerFlex Manager, it is mandatory to provide the PowerFlex Manager Domain Name. VXFMLOCAL is the domain name for the default admin user.

Verify the status of all accounts.


Now we have finished creating all the required accounts to monitor the RAMS system. Similarly, you can add multiple PowerFlex systems and monitor them using the management pack. In my case, I have one more PowerFlex system named VIKINGS and I have added all the required accounts as given in the following screenshot. As you can see below, for the VIKINGS system I have configured seperate instances for CO, SO, and Controller nodes. This is because the iDRAC credentials for CO, SO, and Controller nodes are different. 


In the dashboards section, you can see all the 13 dashboards. Depending on the number of components/ size of the PowerFlex system, it may take 15-20 minutes for the data to get populated in the respective dashboards. 


In the next part, we will go through the different dashboards and other capabilities of the management pack. Hope it was useful. Cheers!

References

Friday, October 30, 2020

Dell EMC PowerFlex MP for vROps 8.x - Part1 - Install

Dell EMC has recently released a vROps management pack for PowerFlex. It is a monitoring and alerting solution that provides extensive visibility into PowerFlex systems using vROps. The management pack collects key metrics for PowerFlex storage, networking, compute, and server hardware and ingests into vROps. The solution is available to all PowerFlex rack and appliance customers free of cost. This brings additional value to the IT operations and life cycle management functionality delivered by PowerFlex Manager.

Now, let's start with installation of the management pack. The steps are same for vROps 8.0, 8.1, and 8.2.

Administration - Solutions - Repository - Add/ Upgrade

Browse and select the PAK file and click upload.


Click next.


Accept the EULA and click next.


Click finish.


The management pack is now installed and it will be listed in the repository.


Verify the contents of the management pack by selecting view content.


Verify the 13 dashboards.
Note: If any of the dashboards are missing, then try to reinstall the management pack.


In the next part, we will go through the adapter instance configurations. Hope it was useful. Cheers!

Related posts


Part2 - Configure
Part3 - Dashboards
Part4 - Resource kinds and relationships


References


Wednesday, September 18, 2019

vRealize Operations Manager 7.5 - Part7 - vSAN monitoring and troubleshooting

In this article, I will walk you through how to use vROps for vSAN monitoring and performance troubleshooting. It is always recommended to follow a systematic and established approach to troubleshoot problems. Before we start here is a link to one of my article which explains the scientific method of troubleshooting

Given below are some very useful content from VMware that talks about vSAN performance troubleshooting.

Performance Troubleshooting – Understanding the Different Levels of vSAN Performance Metrics
Performance Troubleshooting – Which vSAN Performance Metrics Should be Looked at First?
Troubleshooting vSAN performance

Performance is all relative and sometimes performance issues can be because of the wrong perception. So it is always good to validate it with actual numbers. Compare with a benchmark value or verify all relevant metrics before and after the issue has been reported. Now assume there is a storage issue in the environment. Given below is a systematic order to approach the problem, identify it correctly, isolate it and finally take necessary steps to resolve it. 

vSAN performance troubleshooting approach
  1. Infrastructure: Perform vSAN cluster health check
  2. Virtual machine level: Is there a storage issue observed at the application level?
  3. Virtual machine level: Is there a storage issue per vmdk level?
    1. Latency (vmdk)
    2. IOPS (vmdk)
  4. Cluster level: Look at operations overview at the cluster level
    1. Latency
    2. IOPS
  5. Host level: Identify the IO type that has a performance issue
    1. Read IO
    2. Write IO
  6. Host level: Collect/ analyze metrics of the storage objects
    1. Storage adapter (vmhba)
    2. Disk groups
    3. Cache disk
    4. Capacity disk 
  7. Host level: Collect/ analyze metrics of the network objects
    1. Physical adapter (vmnic)
    2. vSAN network (vmk)
At this point, you have a clearly defined workflow in identifying and resolving the issue. So let's have a look at the various vROps dashboards that provides you end to end visibility of your stack and helps you easily identify and isolate the issue. If there is a problem or abnormality or unusual performance behavior in your vSAN environment, vROps will notify that with alerts based on various metric values it monitors using its inbuilt intelligence and analytics capabilities. Alert generation is based on symptom and alert definitions and this will finally affect the health, risk or efficiency badge of the respective object. Status of the badges, symptoms, alerts, recommendations, historical performance data and time stamps will be very useful in the process of troubleshooting and quickly finding the actual problem.

Infrastructure: Perform vSAN cluster health check

As a starting point, you can make use of integrated health checks from vCenter to verify your vSAN infrastructure.


To understand in-depth about vSAN health checks refer: https://vxplanet.com/2019/01/30/vsan-health-checks-explained-part-1/

Now to get a high-level overview, let's have a look into the health, risk and efficiency badges of vSAN cluster in vROps. Please refer to this blog article from VMware to get a detailed understanding of badges.

Health badge


Risk badge


Alerts


Virtual machine level: Is there a storage issue observed at the application level?

You can make use of application aware operations feature in vROps 7.5 to get full stack visibility. Given below are the list of applications that can be currently monitored using vROps 7.5.


Reference to application aware monitoring: https://blogs.vmware.com/management/2019/05/application-aware-operations-with-vrealize-operations-7-5.html


If your application is not supported or if application aware monitoring is not configured, then you can go with native application performance counters/ methods to identify whether the application itself is observing/ affected by storage latency, low IOPS, etc.

Virtual machine level: Is there a storage issue per vmdk level?

As a first step, you can use the "Troubleshoot a VM" dashboard to understand and track resource usage of a virtual machine.

Troubleshoot a VM - a

Troubleshoot a VM - b

Select the VM object to get more details. Below screenshot shows metrics related to a virtual disk.


Cluster level: Look at operations overview at the cluster level

vSAN operations overview dashboard


Troubleshooting vSAN dashboard

Troubleshooting vSAN - a

Troubleshooting vSAN - b

Troubleshooting vSAN - c

Host level: Identify the IO type that has a performance issue

Host level storage metrics


Host level: Collect/ analyze metrics of the storage objects

Metrics related to a disk group


Read cache and write buffer metrics of a disk group


Performance metrics of a capacity disk


Host level: Collect/ analyze metrics of the network objects

Metrics related to vmnic (physical NIC) and vSAN vmk


Metrics related to network objects will help to determine whether the performance issue is due to resource contention, network misconfiguration, hardware issue, etc.  


References: