Few years ago, I had the opportunity to explore the intricacies of storage performance benchmarking using tools like FIO, DISKSPD, and Iometer. Those studies provided valuable insights into the performance characteristics of various storage solutions, shaping my understanding and approach to storage performance analysis. As I prepare for an upcoming project in this domain, I find it essential to revisit my previous work, reflect on the lessons learned, and share my experiences. This blog post aims to provide a comprehensive overview of my benchmarking journey and the evolving landscape of storage performance studies.

Recent advancements
The field of storage technology has seen significant advancements in recent years. The rise of NVMe and storage-class memory technologies has also redefined high-end storage performance, offering unprecedented speed and efficiency. These advancements highlight the dynamic nature of storage performance benchmarking and underscore the importance of staying updated with the latest tools and methodologies.
Challenges
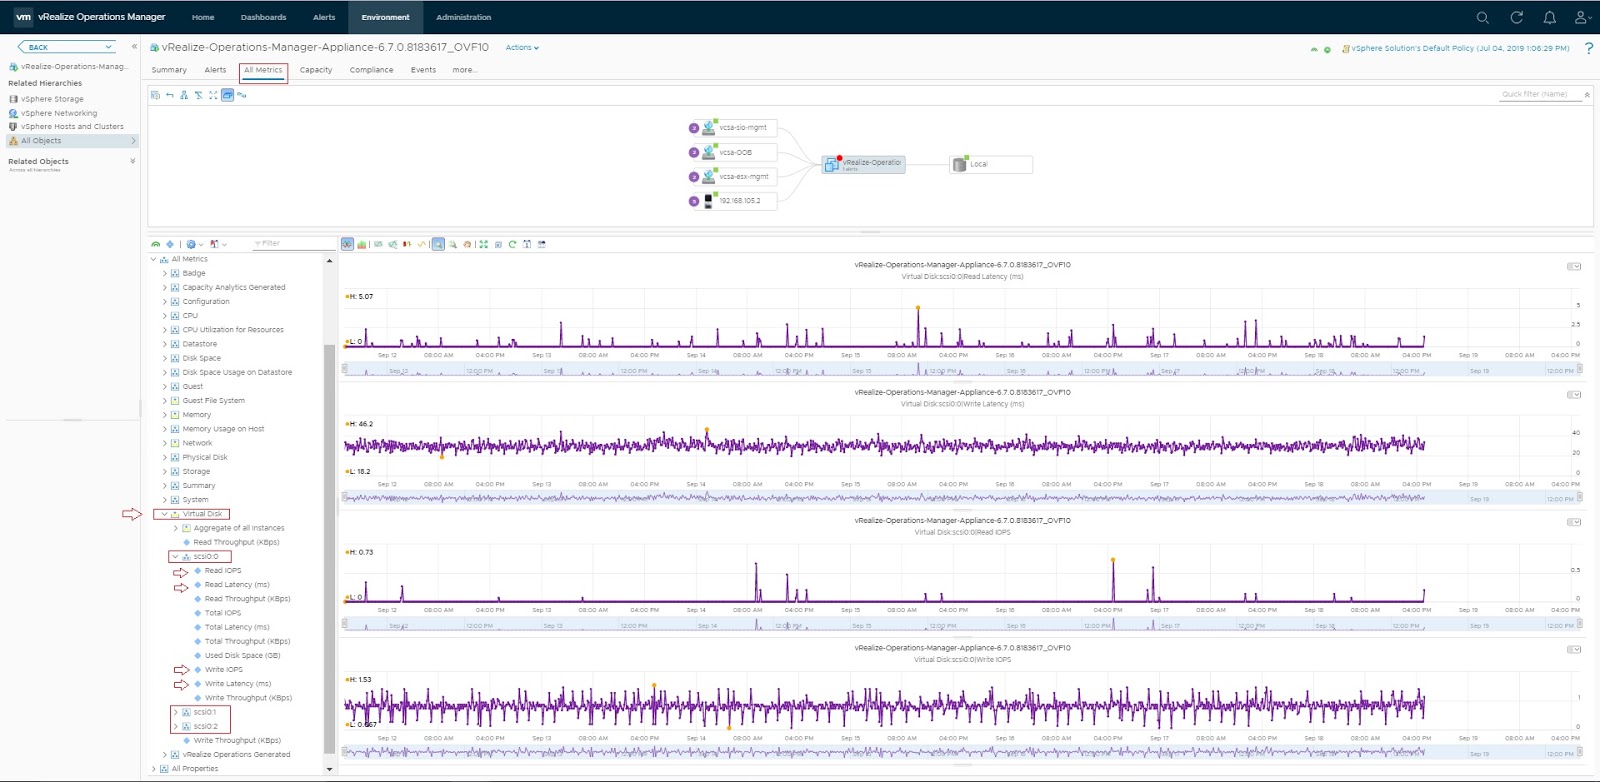
Benchmarking storage performance is not without its challenges. One of the primary difficulties is ensuring a consistent and controlled testing environment, as variations in hardware, software, and network conditions can significantly impact results. Another challenge is the selection of appropriate benchmarks that accurately reflect real-world workloads, which requires a deep understanding of the specific use cases and performance metrics. Additionally, interpreting the results can be complex, as it involves analyzing multiple metrics such as IOPS, throughput, and latency, and understanding their interplay. These challenges necessitate meticulous planning and a thorough understanding of both the benchmarking tools and the storage systems being tested.
Prior works
Following are some of the articles on storage benchmarking that I’ve published in the past:
- Benchmarking vSphere environment using HCIBench
- vSAN performance benchmarking considerations
- Stress test your storage system using Iometer
- Storage performance benchmarking of Kubernetes using FIO StatefulSet
- Benchmarking Kubernetes using K-Bench
Custom storage benchmarking framework
While there are numerous storage benchmarking tools available, such as VMFleet and HCIBench, I wanted to highlight a custom framework I developed a few years ago. Here are some reasons why we created this custom tool:
- Great learning experience: It provided valuable insights into how things work.
- Customization: Being a custom framework, it allows you to add or remove features as needed.
- Flexibility: You can modify multiple parameters to suit your requirements.
- Custom test profiles: You can create tailored storage test profiles.
- No IP assignment needed: There’s no need for IP assignment or DHCP for the stress test VMs.
- Centralized log collection: It offers centralized log collection for detailed analysis.
You can access the scripts and readme on my GitHub repository:
https://github.com/vineethac/vsan_cluster_storage_benchmarking_with_diskspd
Here is an overview.
- Profile Manifest: All storage test profiles are listed in profile_manifest.psd1. You can define as many profiles as you want.
- VM Template: A Windows VM template should be present in the vCenter server.
- Benchmarking Manifest: Details of vCenter, cluster name, VM template, number of stress test VMs per host, etc., are provided in benchmarking_manifest.psd1.
- Deploy Test VMs: deploy_test_vms.ps1 will deploy all the test VMs with pre-configured parameters.
- Start Stress Test: start_stress_test.ps1 will initiate the storage stress test process for all the profiles mentioned in profile_manifest.psd1 one by one.
- Log Collection: All log files will be automatically copied to a central location on the host from where these scripts are running.
- Cleanup: Use delete_test_vms.ps1 to clean up the stress test VMs from the cluster.
Note: These scripts were created about five years ago, and I haven’t had the opportunity to refactor them according to current best practices and new PowerShell scripting standards. I plan to enhance them in the coming months!
This overview should provide you with a clear understanding of the overall process and workflow involved in the storage benchmarking process. I hope it was useful. Cheers!


