Showing posts with label vRealize Operations Manager. Show all posts

Sunday, June 27, 2021

vSphere with Tanzu using NSX-T - Part9 - Monitoring

In the previous posts we discussed the following:

Part1 - Prerequisites

Part2 - Configure NSX

Part3 - Edge Cluster

Part4 - Tier-0 Gateway and BGP peering

Part5 - Tier-1 Gateway and Segments

Part6 - Create tags, storage policy, and content library

Part7 - Enable workload management


In this article, I will explain some of the popular tools used for monitoring Kubernetes clusters that provides insight into different objects in K8s, status, metrics, logs, and so on.

  • Lens
  • Octant
  • Prometheus and Grafana
  • vROps and Kubernetes Management Pack
  • Kubebox


-Lens-

Download the Lens binary file from: https://k8slens.dev/


I am installing it on a Windows server. Once the installation is complete, the first thing you have to do is to provide the Kube config file details so that Lens can connect to the Kubernetes cluster and start monitoring it.

Add Cluster

Click File - Add Cluster


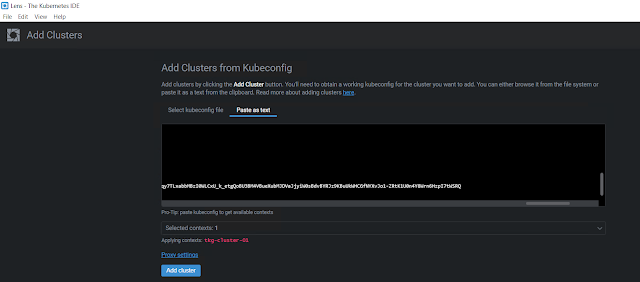
You can either browse and select the Kube config file or you can paste the content of your Kube config file as text. I am just pasting it as text.


Once you have pasted your Kube config file contents, make sure to select the context, and then click Add cluster.


Deploy Prometheus stack

If you aren't seeing CPU and memory metrics, you will need to install the Prometheus stack on your K8s cluster. And Lens has a feature that deploys the Prometheus stack on your K8s cluster with the click of a button!

Select the cluster icon and click Settings.


Scroll all the way to the end, and under Features, you will find an Install button. In my case, I've already installed it, that's why it's showing the Uninstall button.


Once you click the Install button, Lens will go ahead and install the Prometheus stack on the selected K8s cluster. After few minutes, you should be able to see all the metrics.

You can see a namespace called "lens-metrics" and under that, the Prometheus stack components are deployed.


Following are the service objects that are created as part of the Prometheus stack deployment.


And, here is the PVC that is attached to the Prometheus pod.


Terminal access

Click on Terminal to get access directly to the K8s cluster.


Pod metrics, SSH to the pod, and container logs


Scaling
 
Note: In a production environment, it is always a best practice to apply configuration changes to your K8s cluster objects through a version control system.


You can also see the Service Accounts, Roles, Role Bindings, and PSPs under the Access Control tab. For more details see https://docs.k8slens.dev/main/.


-Octant-

https://vineethac.blogspot.com/2020/08/visualize-your-kubernetes-clusters-and.html


-Prometheus and Grafana-


-vROps and Kubernetes Management Pack-

https://blogs.vmware.com/management/2020/12/announcing-the-vrealize-operations-management-pack-for-kubernetes-1-5-1.html

https://rudimartinsen.com/2021/03/07/vrops-kubernetes-mgmt-pack/

https://www.brockpeterson.com/post/vrops-management-pack-for-kubernetes


-Kubebox-


curl -Lo kubebox https://github.com/astefanutti/kubebox/releases/download/v0.9.0/kubebox-linux && chmod +x kubebox


Select namespace


Select Pod

This will show the selected pod metrics and logs.


Note: Kubebox relies on cAdvisor to retrieve the resource usage metrics. It’s recommended to use the provided cadvisor.yaml file, that’s tested to work with Kubebox. 

kubectl apply -f https://raw.github.com/astefanutti/kubebox/master/cadvisor.yaml

Kubebox: https://github.com/astefanutti/kubebox

Hope it was useful. Cheers!

Friday, January 1, 2021

Dell EMC PowerFlex MP for vROps 8.x - Part7 - Create custom reports

In March 2020, I published a blog on how to create custom views and reports in vROps 8.x. This article explains how to create a custom storage report for Dell EMC PowerFlex using the PowerFlex Management Pack for vROps 8.x. 

Sample PowerFlex Storage Report PDF and template is available in my GitHub repo for download. You can use it as a starting point/ modify it as per requirement.

To create a new view: Dashboards - Views - Add.

Provide a name and description for the new view. Here, for example, I will create a view that shows PowerFlex Protection Domain Info.


Select List.


Select Protection Domain as subject and group it by PowerFlex Rack/ Appliance System.


Double click or drag and drop the selected metrics or properties to include in the view. In the following screenshot, I selected 4 capacity metrics to include in the view.


You can also select and change the units and transformation as per requirements. Once it is done, click Save.

Now a view is created. Similarly, you can create multiple views for the different PowerFlex resource kinds. The next step is to include this view in an existing template or in a new template. 

To create a new report template: Dashboards - Reports - Add.

  • Provide a name and description for the new report template.
  • From the views and dashboards, find the PowerFlex Protection Domain Info view that we created earlier, double-click or drag and drop them to the right pane. You can add multiple views to be included in this report template.
  • Select PDF and CSV.
  • Select all the layout options if you like to and click Save.
  • Now the custom report template is created. You can select it and click Run.

Select PowerFlex and then select PowerFlex World and click ok.


The report will run in the background and will be available to download under the "Generated Reports" tab. You can select it and download the PDF or CSV file. You can even configure a schedule to generate a report and email it or save it to a location automatically based on your requirements. Hope it was useful. Cheers!

Related posts


Tuesday, December 15, 2020

Dell EMC PowerFlex MP for vROps 8.x - Part6 - Create custom alerts

In this post, we will take a look at creating custom alerts for PowerFlex by adding symptom definitions and alert definitions. Refer to my previous blog post to understand more about the alerting aspects in vROps. Here we will take an example scenario and see how we can create custom symptom definitions and alert definitions.

Scenario


The user is running some latency-sensitive business-critical applications using PowerFlex storage. Below are the symptoms that he would like to define and alerts should be produced for the same and these should affect the "Health" badge of the PowerFlex volume object.


Step1: Add Symptom Definitions


Go to Alerts - Symptom Definitions - Click Add.

Select base object type: Expand PowerFlex Adapter - Select Volume.

  • Select the metric User Data SDC Read Latency (ms): double click on it twice so that you can define both warning and critical symptoms.
  • Select the metric User Data SDC Write Latency (ms): double click on it twice so that you can define both warning and critical symptoms.

Now, fill all the required fields as per the conditions we defined earlier.


Click Save. Now as you can see below the 4 symptom definitions are created.


Step2: Add Alert Definitions


Go to Alerts - Alert Definitions - Click Add.

  • Provide alert name, select the base object type and advanced settings and click Next.

  • Filter and search the symptoms that we created earlier. Drag and drop the two volume read latency related symptoms and select Any. Click Next.

  • If you want to provide any recommendations you can add it in this step and click Next.
  • Select vSphere Solution's Default Policy and click Next and click Create.
Similarly, you can create an alert definition for PowerFlex Volume Write Latency too.


Now, we are all done. Let's test the alerts! I am using FIO to generate IO load on one of the PowerFlex volume.


You can see the Read Latency for this volume is grater than 1 ms, and so a warning alert should be produced for this specific volume.


Hope it was useful. Cheers!

Related posts


Part1: Install
Part2: Configure
Part3: Dashboards
Part4: Resource kinds and relationships
Part5: Collection interval 


References


Friday, December 4, 2020

Dell EMC PowerFlex MP for vROps 8.x - Part5 - Collection interval

In this post, we will take a look at modifying the collection interval of  PowerFlex Adapter instances. The PowerFlex Management Pack for vROps supports 4 instance types.

  • PowerFlex Gateway
  • PowerFlex Networking
  • PowerFlex Manager
  • PowerFlex Nodes

The default collection interval for all these adapter instances is set to 5 minutes. In most cases, you don't need to modify this. But, say you want to get PowerFlex storage performance metrics more frequently, then you have to change the collection interval of the PowerFlex Gateway instance. You can set it to as low as 1 minute. As per the testing that I have done in the lab, a PowerFlex Gateway adapter instance is able to complete the collection process of a PowerFlex storage cluster in less than a minute.

Note: If you are modifying the collection interval from the default value, make sure to verify that the collection process is able to complete successfully within the new time interval.

Administration - Inventory - Adapter Instances - PowerFlex Adapter Instance

Note: In the product guide it is recommended to configure not more than 40 Cisco switches in one PowerFlex Networking instance. So, if you have 80 switches in your PowerFlex system, you will need to configure 2 PowerFlex Networking instances where each instance will connect/ query/ collect details from 40 switches. This is based on the default collection interval of 5 minutes.

This simply means, in 5 minutes one PowerFlex Networking adapter instance can complete the collection from a max of 40 switches only. So, in 1 minute, it can complete the collection of a maximum of 8 switches. This is a rough calculation and it depends on factors like REST API response, switch firmware/ OS version, etc. So if you change the default interval, always make sure to monitor it (the collection cycle) for some time and verify whether the collection process is able to complete successfully within the new time interval. 

Hope it was useful. Cheers!

Related posts


Part1 - Install
Part2 - Configure
Part3 - Dashboards
Part4 - Resource kinds and relationships


References


Saturday, November 28, 2020

Storage performance benchmarking of Tanzu Kubernetes Clusters

Benchmarking of IT infrastructure is standard practice and is usually done before putting it into a production environment. It gives you baseline values about different performance aspects of the system/ solution under test. These benchmarking principles are applicable for Kubernetes clusters too. But the test cases and evaluation criteria may slightly vary compared to benchmarking a traditional IT infrastructure. 

Following are some of the test considerations:

  • Performance of PVCs.
    • Time to provision PVCs.
    • Read/ Write IOPS and Latency of PVCs.
  • Pod startup latency.
  • The time consumed to complete the deployment of different K8s objects.
    • Statefulset
    • Deployment etc.
  • Performance behavior of sample application workloads.
  • Network performance and connectivity between different K8s nodes.

In this article, I will explain a quick and easy way to benchmark the storage system used by the Kubernetes cluster to provision PVCs for application workloads. I am using FIO to generate storage IOs. You can use the following YAML file to deploy FIO pods as a statefulset. Note that here I am using PowerFlex VVOL datastore as Cloud Native Storage (CNS) for Tanzu K8s clusters and so the storage class "powerflex-storage-policy". This may differ in your case, and you might need to modify it to match the storage class available in your setup.


This YAML file will deploy a statefulset with 15 FIO pods (as per the number of replicas mentioned) and will start the storage IO stress test (8k block size, 70% random reads, 30% random writes, 2 jobs, 16 iodepth) on the attached PVC as and when the pod is started. Total 15 PVCs will be created in this case, and one PVC will get attached to one FIO pod. 

Note: If you get an error "forbidden: unable to validate against any pod security policy" after applying the above statefulset, then the pods will not get created. You will need to first create and apply Pod Security Policy (PSP) to the Tanzu Kubernetes Cluster.


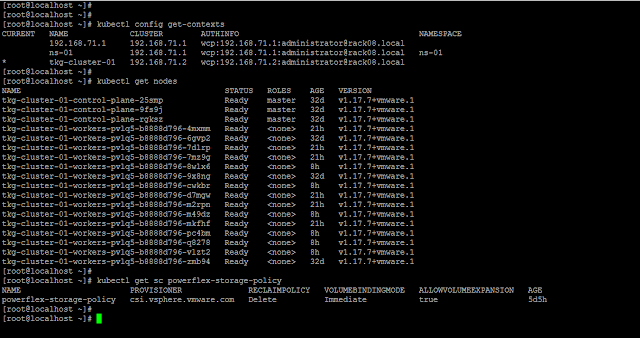
Following is an overview of my vSphere with Tanzu setup:

Tanzu K8s control plane nodes/ master VMs: 3
Tanzu K8s worker nodes/ VMs: 15


Contexts, Tanzu K8s cluster nodes, and storage class.


Create a statefulset using the above YAML file.
kubectl apply -f https://gist.githubusercontent.com/vineethac/7c9f6ce2b72868b8832a4404b79ebba2/raw/980f9d6c24c10b1b7b39b20d80c15a9f2ee6c4f1/fio_ss.yaml -n <namespace name>


You can see that it took roughly 6 minutes to deploy 15 FIO pods and corresponding PVCs. The time may vary depending on whether the FIO image is locally available on the nodes, available resources on the nodes, etc.  


As and when each pod is created, FIO will automatically start IO stress on it. IOs will be read/ written into the attached PVCs. As I mentioned earlier, I am using a storage class "powerflex-storage-policy" and this is associated with a VVOL datastore backed by a PowerFlex storage pool. In this case, all the PVCs are created in a PowerFlex VVOL datastore.


You can also see multiple volumes in the PowerFlex UI and all those volume names starting with "vasa" are externally managed by the PowerFlex VASA provider. The performance of each volume can be also be monitored using the PowerFlex UI.


If you would like to see the historical performance data, you can use vROps. Dell EMC has recently released a vROps management pack for PowerFlex systems. It is a monitoring and alerting solution that provides extensive visibility into the PowerFlex infrastructure. For monitoring K8s clusters and resources, you can use the vROps management pack for container monitoring


Note: When the duration mentioned in the FIO test is over, the pods will get restarted and the IO stress will also start. To modify the FIO parameters you can use kubectl edit statefulset fiopod-statefulset-multipod -n fiogit modify required parameters and save it. After saving it the new changes will get applied automatically. Once you are done with the testing, you can delete the statefulset and the corresponding PVCs using kubectl delete command. This method is useful when you want to test something quickly or if you have only less test profiles. If you have many test profiles with varying block sizes, iodepth, etc, then you will need to build a small script or something to automate the process. 

Hope it was useful. Cheers!


Related articles


References


Sunday, November 8, 2020

Dell EMC PowerFlex MP for vROps 8.x - Part4 - Resource kinds and relationships

In this post, we will take a look at the different resource kinds that are part of the Dell EMC PowerFlex Management Pack. Following is a very high-level logical representation of the PowerFlex Adapter resource kinds and their relationships:


Go to Environment - All objects - PowerFlex Adapter


You can also get a PowerFlex system level view in vROps using the PowerFlex rack/ appliance system resource kind. This system view is making use of the system name field that we provided while configuring each PowerFlex Adapter instance type. The system name is used to group all the logical components of one PowerFlex system. 


This view provides end-to-end visibility of the PowerFlex infrastructure components that will be useful to understand the relationship between different layers of the stack. This will be also helpful to identify and troubleshoot in case of issues.

Hope it was useful. Cheers!

Related posts


Part1 - Install
Part2 - Configure
Part3 - Dashboards


Wednesday, November 4, 2020

Dell EMC PowerFlex MP for vROps 8.x - Part3 - Dashboards

We have covered the installation and configuration of the PowerFlex Management Pack in the previous posts. In this post, we will have a look at the different dashboards that are part of the MP. Following are the 13 dashboards you will get after installing the MP:

Overview
  • PowerFlex System Overview
PowerFlex Manager
  • PowerFlex Manager Details
Management Controller 
  • PowerFlex Management Controller
Compute
  • PowerFlex ESXi Cluster Usage
  • PowerFlex ESXi Host Usage
  • PowerFlex SVM Utilization
Networking
  • PowerFlex Networking Environment
  • PowerFlex Networking Performance
Storage
  • PowerFlex Summary
  • PowerFlex Details
  • PowerFlex Replication Details
Server Hardware
  • PowerFlex Node Summary
  • PowerFlex Node Details

Now, let's have a quick look at some of these dashboards and their functionality.

PowerFlex Node Summary


This dashboard shows the health of all PowerFlex nodes being monitored by the MP. You can see the classification of nodes as Compute Only, Storage Only, Hyperconverged, and Management Controller along with a relationship between a node and its corresponding hardware components.


PowerFlex Summary


This dashboard shows the health status of all the logical components of the PowerFlex storage system. It also has a parent-child relationship between different objects of the storage system. You can also see widgets for capacity usage trend forecasting, alerts, top storage pools by capacity usage, top volumes by size, etc.


PowerFlex Details


This dashboard shows all PowerFlex storage performance KPIs like IOPS, Bandwidth, Latency, etc.


PowerFlex Networking Environment


You can see the health status of Cisco networking components and the relationship between network interfaces, nodes, switch ports, VLANs, port-channels, etc.


PowerFlex Networking Performance


This dashboard shows the switch and switch port KPIs like Throughout, Errors, Packet discards, etc.


PowerFlex Manager


You can see the service deployment details like service health, RCM compliance status, deployment status, etc. in this dashboard.


Hope it was useful. Cheers!

References