Showing posts with label benchmarking. Show all posts

Friday, September 6, 2024

Revisiting Storage Performance Benchmarking

Few years ago, I had the opportunity to explore the intricacies of storage performance benchmarking using tools like FIO, DISKSPD, and Iometer. Those studies provided valuable insights into the performance characteristics of various storage solutions, shaping my understanding and approach to storage performance analysis. As I prepare for an upcoming project in this domain, I find it essential to revisit my previous work, reflect on the lessons learned, and share my experiences. This blog post aims to provide a comprehensive overview of my benchmarking journey and the evolving landscape of storage performance studies.


Recent advancements 

The field of storage technology has seen significant advancements in recent years. The rise of NVMe and storage-class memory technologies has also redefined high-end storage performance, offering unprecedented speed and efficiency. These advancements highlight the dynamic nature of storage performance benchmarking and underscore the importance of staying updated with the latest tools and methodologies.

Challenges

Benchmarking storage performance is not without its challenges. One of the primary difficulties is ensuring a consistent and controlled testing environment, as variations in hardware, software, and network conditions can significantly impact results. Another challenge is the selection of appropriate benchmarks that accurately reflect real-world workloads, which requires a deep understanding of the specific use cases and performance metrics. Additionally, interpreting the results can be complex, as it involves analyzing multiple metrics such as IOPS, throughput, and latency, and understanding their interplay. These challenges necessitate meticulous planning and a thorough understanding of both the benchmarking tools and the storage systems being tested.

Prior works

Following are some of the articles on storage benchmarking that I’ve published in the past:

Custom storage benchmarking framework

While there are numerous storage benchmarking tools available, such as VMFleet and HCIBench, I wanted to highlight a custom framework I developed a few years ago. Here are some reasons why we created this custom tool:

  • Great learning experience: It provided valuable insights into how things work.
  • Customization: Being a custom framework, it allows you to add or remove features as needed.
  • Flexibility: You can modify multiple parameters to suit your requirements.
  • Custom test profiles: You can create tailored storage test profiles.
  • No IP assignment needed: There’s no need for IP assignment or DHCP for the stress test VMs.
  • Centralized log collection: It offers centralized log collection for detailed analysis.


You can access the scripts and readme on my GitHub repository:

https://github.com/vineethac/vsan_cluster_storage_benchmarking_with_diskspd


Here is an overview.

  • Profile Manifest: All storage test profiles are listed in profile_manifest.psd1. You can define as many profiles as you want.
  • VM Template: A Windows VM template should be present in the vCenter server.
  • Benchmarking Manifest: Details of vCenter, cluster name, VM template, number of stress test VMs per host, etc., are provided in benchmarking_manifest.psd1.
  • Deploy Test VMs: deploy_test_vms.ps1 will deploy all the test VMs with pre-configured parameters.
  • Start Stress Test: start_stress_test.ps1 will initiate the storage stress test process for all the profiles mentioned in profile_manifest.psd1 one by one.
  • Log Collection: All log files will be automatically copied to a central location on the host from where these scripts are running.
  • Cleanup: Use delete_test_vms.ps1 to clean up the stress test VMs from the cluster.


Note:
 These scripts were created about five years ago, and I haven’t had the opportunity to refactor them according to current best practices and new PowerShell scripting standards. I plan to enhance them in the coming months!

This overview should provide you with a clear understanding of the overall process and workflow involved in the storage benchmarking process. I hope it was useful. Cheers!

Saturday, January 23, 2021

Benchmarking Kubernetes infrastructure using K-Bench

K-Bench is a framework to benchmark the control and data plane aspects of a Kubernetes cluster. More details are available at https://github.com/vmware-tanzu/k-bench. In my case, I am going to conduct this benchmarking study on a Tanzu Kubernetes cluster which is provisioned using Tanzu Kubernetes Grid service on a vSphere 7 U1 cluster.

Step 1: Clone the K-Bench repo

git clone https://github.com/vmware-tanzu/k-bench.git


Step 2: Install

./install.sh


Once the installation is done it will say, "Completed k-bench installation.".

Step 3: Run the benchmark

./run.sh


If you don't specify any test, then it is going to conduct the default set of tests. All sets of tests are defined under the config directory. If you browse to the config directory and list, there are separate folders specific to each test. You can see folders starting with cp and dp, and it refers to control plane and data plane related tests.


If no specific test is mentioned, then it is going to run all that is defined in the default directory. You can also see details of the test and results in the logs. The directories starting with "results" will have log files corresponding to each test run.


Following is a sample log that shows a summary of pod creation throughput, pod creation average latency, pod startup total latency, list/ update/ delete pod latency, etc.


Now, if you want to run a specific test case, you can do it as follows:
Usage: ./run.sh -r <run-tag> [-t <comma-separated-tests> -o <output-dir>]
DP network internode test

For example, you can run a data plane test to check the network performance between two nodes as shown below.

./run.sh -r "kbench-run-on-tkg-cluster-02"  -t "dp_network_internode" -o "./"


As soon as you run the above command, two pods will be created inside "kbench-pod-namespace" on two worker nodes as you see below.


It will then start "iperf3" process inside those two pods to create a network load following a client-server model as per the actions defined in the config.json file.


Sample logs are given below. It shows details like the amount of data transferred, transfer rate, network latency, etc.


Once the test run is complete, the pods and other resources created will be automatically deleted. Similarly, you can select the other set of tests that are pre-defined in the framework. I believe you have the flexibility to define custom test cases too as per your requirements. I hope it was useful. Cheers!

Related posts


Storage performance benchmarking of Tanzu Kubernetes clusters
Monitoring Tanzu Kubernetes cluster using Prometheus and Grafana


References


Saturday, November 28, 2020

Storage performance benchmarking of Tanzu Kubernetes Clusters

Benchmarking of IT infrastructure is standard practice and is usually done before putting it into a production environment. It gives you baseline values about different performance aspects of the system/ solution under test. These benchmarking principles are applicable for Kubernetes clusters too. But the test cases and evaluation criteria may slightly vary compared to benchmarking a traditional IT infrastructure. 

Following are some of the test considerations:

  • Performance of PVCs.
    • Time to provision PVCs.
    • Read/ Write IOPS and Latency of PVCs.
  • Pod startup latency.
  • The time consumed to complete the deployment of different K8s objects.
    • Statefulset
    • Deployment etc.
  • Performance behavior of sample application workloads.
  • Network performance and connectivity between different K8s nodes.

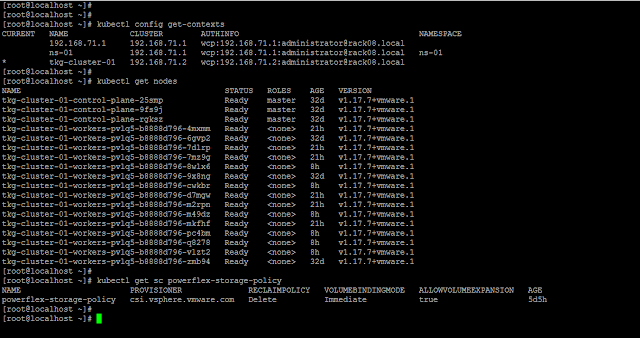
In this article, I will explain a quick and easy way to benchmark the storage system used by the Kubernetes cluster to provision PVCs for application workloads. I am using FIO to generate storage IOs. You can use the following YAML file to deploy FIO pods as a statefulset. Note that here I am using PowerFlex VVOL datastore as Cloud Native Storage (CNS) for Tanzu K8s clusters and so the storage class "powerflex-storage-policy". This may differ in your case, and you might need to modify it to match the storage class available in your setup.


This YAML file will deploy a statefulset with 15 FIO pods (as per the number of replicas mentioned) and will start the storage IO stress test (8k block size, 70% random reads, 30% random writes, 2 jobs, 16 iodepth) on the attached PVC as and when the pod is started. Total 15 PVCs will be created in this case, and one PVC will get attached to one FIO pod. 

Note: If you get an error "forbidden: unable to validate against any pod security policy" after applying the above statefulset, then the pods will not get created. You will need to first create and apply Pod Security Policy (PSP) to the Tanzu Kubernetes Cluster.


Following is an overview of my vSphere with Tanzu setup:

Tanzu K8s control plane nodes/ master VMs: 3
Tanzu K8s worker nodes/ VMs: 15


Contexts, Tanzu K8s cluster nodes, and storage class.


Create a statefulset using the above YAML file.
kubectl apply -f https://gist.githubusercontent.com/vineethac/7c9f6ce2b72868b8832a4404b79ebba2/raw/980f9d6c24c10b1b7b39b20d80c15a9f2ee6c4f1/fio_ss.yaml -n <namespace name>


You can see that it took roughly 6 minutes to deploy 15 FIO pods and corresponding PVCs. The time may vary depending on whether the FIO image is locally available on the nodes, available resources on the nodes, etc.  


As and when each pod is created, FIO will automatically start IO stress on it. IOs will be read/ written into the attached PVCs. As I mentioned earlier, I am using a storage class "powerflex-storage-policy" and this is associated with a VVOL datastore backed by a PowerFlex storage pool. In this case, all the PVCs are created in a PowerFlex VVOL datastore.


You can also see multiple volumes in the PowerFlex UI and all those volume names starting with "vasa" are externally managed by the PowerFlex VASA provider. The performance of each volume can be also be monitored using the PowerFlex UI.


If you would like to see the historical performance data, you can use vROps. Dell EMC has recently released a vROps management pack for PowerFlex systems. It is a monitoring and alerting solution that provides extensive visibility into the PowerFlex infrastructure. For monitoring K8s clusters and resources, you can use the vROps management pack for container monitoring


Note: When the duration mentioned in the FIO test is over, the pods will get restarted and the IO stress will also start. To modify the FIO parameters you can use kubectl edit statefulset fiopod-statefulset-multipod -n fiogit modify required parameters and save it. After saving it the new changes will get applied automatically. Once you are done with the testing, you can delete the statefulset and the corresponding PVCs using kubectl delete command. This method is useful when you want to test something quickly or if you have only less test profiles. If you have many test profiles with varying block sizes, iodepth, etc, then you will need to build a small script or something to automate the process. 

Hope it was useful. Cheers!


Related articles


References


Saturday, April 18, 2020

vSAN performance benchmarking

In this article, I will explain briefly on performance benchmarking considerations, factors affecting performance, and some of the best practices. We do performance benchmarking to understand the capabilities and bottlenecks of a system. When I say system it could be a storage system, CPU, GPU, network switch, etc. Now let's consider a VMware vSAN cluster infrastructure. It includes multiple components and each of these contributes to the performance. In this case, the vSAN cluster is the solution under test. We will have to conduct performance benchmarking to understand the storage performance behavior of the cluster. When I say storage behavior it includes the IOPS, latency, and throughput that the cluster can produce under varying loads.

The goal of benchmarking
  • Identify bottlenecks
    • Hardware bottleneck
    • Software bottleneck
    • Application bottleneck
  • Compare tradeoffs
  • Manage expectations
  • Make decisions

Usually in a real-world scenario, benchmarking will be done once the cluster is deployed/ ready and before starting to host production workload on top of it. As these benchmark values define the performance maximums it will be helpful to decide on when to scale or upgrade the cluster before it hits a bottleneck.

Fundamental factors of vSAN performance

Server hardware
  • Compatibility as per vSAN HCL
Host
  • Number of hosts in the cluster
  • Power settings
  • CPU - number of cores and frequency 
Storage
  • Hybrid or All-flash
  • NVMe, SAS, or SATA
  • Number of disk groups per host
  • Storage controller configuration
  • Compatibility of hardware devices as per vSAN HCL
Network
  • 10/ 25/ 40 GbE
  • MTU 
  • LAG
SPBM policy
  • FTT (Failures To Tolerate)
  • FTM (Mirroring/ Erasure coding)
  • Thin or Thick provision
Security
  • Encryption
  • Checksum
Other
  • Stripe width
  • Flash read cache reservation
  • IOPS limit for object
All of the above factors will affect performance. So you should know the benefits and tradeoffs. 

Benchmarking methodology

Image credit: VMware

Storage benchmarking tools

IO load generation tools
Application-specific tools
  • HammerDB (MSSQL, Oracle)
  • Jetstress (MS Exchange)
  • SLOB (Oracle)
  • DBGen (MSSQL, Oracle)

Best practices

  • Understand the production performance metrics.
  • Test what you plan to deploy.
  • Workload modeling.
  • Plan for use case testing.
  • Choose an appropriate size for benchmarking
  • Choose the right tool.
  • Pre-allocate blocks while testing.
  • Test for a longer time duration.
  • Deploy multiple VMs with multiple VMDKs.

References

Thursday, August 31, 2017

Benchmarking hyper-converged vSphere environment using HCIBench

In this article I will explain briefly about using HCIBench for storage benchmarking vSphere deployments. I recently had a chance to try HCIBench on a ScaleIO cluster running on a 3 node ESXi 6.0 cluster. Latest version of the tool can be downloaded from here.

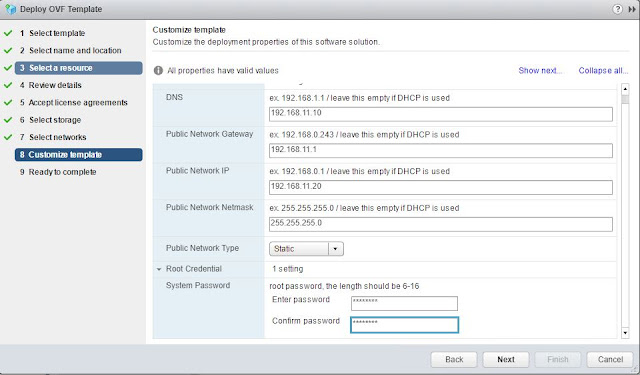
I conducted the tests with HCIBench version 1.6.5.1.  Installation steps are very straight forward. You can install it on one of the ESXi nodes using "Deploy OVF Template" option.

*Browse and select the template.
*Provide a name and select location.
*Select a resource to host HCIBench.
*Review details and click Next.
*Accept license agreements.
*Select a datastore to store HCIBench files.
*Select networks (as shown below).


Note:
Public network is the network through which you can access management web GUI of HCIBench.
Private network is the network where HCIBench test VMs will be deployed.

*Provide management IP details (I am using static IP)  and root password for HCIBench  as shown below.


*Click Next and Finish.
*Once the deployment is complete, you can power on the HCIBench VM.
*Web GUI can be accessed by: <IP address>:8080
*Provide root credentials to access the configuration page.

In the configuration page fill the necessary details as given below.

*vCenter IP.
*vCenter username and password.
*Datacenter name.
*Cluster name.
*Network name (the network on which HCIBench test VMs will be deployed).

Note:
The network on to which HCIBench test VMs will be deployed should have a DHCP server to provide IPs to the test VMs. If you do not have a DHCP server available in that network, select "Set Static IP for Vdbench VMs" as shown below. In this case HCIBench will provide IPs to the test VMs through the private network that you have chosen in the earlier installation step. Here, I don't have a DHCP server in VMNet-SIO network. So I connected eth1 of HCIBench to VMNet-SIO (private network) and checked the option "Set Static IP for Vdbench VMs".

*Provide datastore names.


*Provide ESXi host username and password.
*Total number of VMs.
*Number of data disks per VM.
*Size of each data disk.

Note:
Make sure to keep a ratio between the total number of datastores, number of ESXi nodes and the number of test VMs. Here I have 3 ESXi nodes and 3 datastores in the cluster. So if I deploy 9 VMs for the test, each ESXi node will host 3 test VMs, one on each datastore. 


*Give a name for the test.
*Select the test parameters.
*You can use the Generate button to customize the parameters (shown in next screenshot).


*Input parameters as per your requirement and submit.


*If you are doing this the very first time, you will find the below option at the end of the page to upload Vdbench ZIP file. You can upload the file if you have one, or you can download it from the Oracle website using the Download button.
*After providing necessary inputs, you can save the configuration and validate. If the validation passes, you can click on test to begin the benchmarking test.


*Once the test is complete, click on the Result button and it will take you to the directory where result files are stored. 

Hope the article was useful to you. Happy benchmarking. Cheers!

Tuesday, July 18, 2017

Best practices while building a Hyper-V host

This article explains briefly about some of the best practice considerations while building a stand-alone Hyper-V 2012 R2/ 2016 host. You can use any compatible hardware, but here I will be explaining using Dell PowerEdge servers as I am working with them everyday.

  1. Select proper hardware

    You have to be really careful before purchasing a server. Analyze the requirements first and work a bit on capacity planning too. For example, PowerEdge R630 will be a good choice to start with as it is a 1U system with 2 processors. It can have up to 1.5 TB memory, but generally most SMB customers go with somewhere around 128 GB. Choosing the right network controller is also very important as it directly impacts the data transfer performance of the virtual machines. If you are planning to use converged networking on the host, select appropriate adapter. I recommend using one 10G dual port network card at the minimum for a converged network configuration. If you are looking for redundancy at network card level, then you can go with two 10G dual port cards. You can also go forward with multiple dual port or quad port 1G cards as per your requirements in case of budget limitations.  

  2. Number of disks, type of disks and RAID controller

    On a stand alone host, mostly customers will be using the local drives and if they need additional storage it will be provisioned from a SAN. The number of disks and the type of disks (SSD, SAS, NL-SAS etc.) will have direct impact on performance at storage level. Also, it is very important to select the right RAID controller. RAID types supported, size of controller cache, read/ write policies etc. are some of the major parameters that you have to consider while choosing the RAID controller card. Dell uses PERC (PowerEdge RAID Controller). For example, you can select PERC H730P which has 2 GB cache memory and a BBU and supports RAID levels 0,1,5,6,10,50 and 60. H710P also supports 4 KB block size disk drives. For more info please have a look at my article RAID configuration using PERC.

  3. Always use and follow HCL (Hardware Compatibility List)
  4. Configure out-of-band management. Dell uses iDRAC which helps you to manage your server remotely
  5. Update BIOS, firmware and drivers to the latest and greatest version
  6. Make sure you install all the necessary Windows updates
  7. Partition style, file system and AUS (Allocation Unit Size) of the drive where VM files will be saved

    Say, you are going to save all the VM files in drive D. While creating this drive select GPT partition style. If you are running Hyper-V 2012 R2, then use NTFS file system with AUS 64 KB. If you are having Hyper-V 2016, then use ReFS with 4 KB AUS. Please refer this MSFT article for more info.

  8. Always create a NIC team and select right teaming modes

    The most widely used teaming mode is switch independent + dynamic load balancing as it is the least complicated in terms of configuration and has no dependency on your switches. But if your switches support VLT (for Dell) or vPC (for Cisco) technology then the best teaming mode will be LACP + dynamic load balancing which provides you redundancy as well as aggregated throughput of all the active links in the team.

  9. Use separate VLANs for different types of traffic

    It is recommended to use separate VLANs for management, VM traffic, iSCSI, live migration and iDRAC.

  10. If using converged networking assign proper minimum bandwidths. Reference article for QoS recommendations linked here.
  11. Use minimum number of vSwithes
  12. Configure MPIO if adding additional storage from a SAN
  13. Set jumbo frames for iSCSI interfaces 
  14. Disable NetBIOS over TCP/ IP and DNS registration on iSCSI NICs

    Please check my post: Best practice recommendations for iSCSI network adapters

  15. Enable shared nothing live migration. For more info please check my previous post 
  16. If using 10G NICs make use of VMQ

    Please have a look at this MSFT article which provides you tips on VMQ CPU assignment

  17. Add exclusions for VHD/ VHDX files from scanning if antivirus is installed
  18. Run necessary stress tests to benchmark the system

    Benchmarking helps to get an overview of the IOPS numbers in the best/ worst case scenarios, so that you can provision your workload accordingly avoiding IO congestion at storage level. You can use synthetic benchmarking tools like iometer, diskspd etc. for conducting stress tests. Also go through my article:  How to calculate total IOPS supported by a disk array. But please note that these calculations doesn't take in to account on the effect of controller cache. That means the actual IOPS values while benchmarking the system will be higher than that of the values you got from the formula which is because of the effect of cache. When you select a write-back policy, all write IOs will land directly on the controller cache and will be acknowledged. Later those will be flushed to the disk array. Larger the cache size higher the IO performance. This shows the importance of choosing the right RAID controller.

  19. Choose OS power plan High Performance
  20. Make sure PSRemoting is enabled
  21. Enable proper monitoring either using a monitoring tool or custom scripts
  22. As a DR plan you can consider using Hyper-V replica
  23. Enable RDP
  24. I strongly recommend to create a diagram to visualize connectivity of the host to your network
  25. Organize VM files and folders properly as shown below
Here all VMs are stored in E:\VM folder

Virtual hard disks, VM config files, Snapshot files etc. of each VM is organized in a proper folder structure

I hope this will be helpful if you are totally new to Hyper-V and please feel free to let me know if you have any other best practice suggestions which I missed to mention here. Cheers!

Thursday, May 11, 2017

Benchmarking Hyper-Converged Storage Spaces Direct (S2D) Cluster

Finally I managed to write some PowerShell code as I am completely inspired by my new PS geek friends. The scripts can be used to generate load and stress test your S2D as well as traditional Hyper-V 2016 cluster. These are functionally similar to VM Fleet. There are 7 scripts in total.
  1. create_clustered_testvms.ps1 : this script creates virtual machines on the cluster nodes which will be used for stress testing
  2. start_all_testvms.ps1 : start all those clustered VMs that you just created
  3. io_stress_trigger.ps1 : to trigger IO stress on all VMs using diskspd 
  4. rebalance_all_testvms.ps1 : this script is originally from winblog, I just made a small change so that it will use live migration while moving the clustered VMs back to their owner node
  5. watch_iops_live.ps1 : to view read, write and total iops of each CSV disk on the S2D cluster 
  6. stop_all_testvms.ps1 : to shutdown all the clustered VMs
  7. wipeoff_testvms.ps1 : to delete all VMs that you created using the first script
PS Version which I am using is given below.


Now I will explain briefly about how to use these scripts and a few prerequisites. Say, you have a 4 node hyper-converged S2D cluster.


As there are 4 nodes , you should have 4 cluster shared volumes (CSV). Assign one CSV to each cluster node as shown below. This means when you create VMs on NODE-01, it will be placed on CSV Volume AA, for NODE-02 VMs will be placed on Volume BB and so on. 


Volume AA is C:\ClusterStorage\Volume1


Similarly,
Volume BB is C:\ClusterStorage\Volume2
Volume CC is C:\ClusterStorage\Volume3
Volume DD is C:\ClusterStorage\Volume4


Your cluster shared volumes are ready now. Create 2 folders inside Volume1 as shown below.


Copy all the 7 PS scripts to scripts folder. Code of each script is given at the end.


You now need a template VHDX and that needs to be copied to template folder.
Note: It should be named as "template"


This template is nothing but a Windows Server 2016 VM created on a dynamically expanding disk. So you just have to create a VM with dynamically expanding VHDX, install Windows Server 2016 and set local administrator password to "Pass1234". Download diskspd from Microsoft, unzip it and just copy the diskspd.exe to C drive of the VM you just created.


Shutdown the VM. No need to sysprep it. Copy the VHDX disk of the VM to template folder and rename it to "template". The disk will be around 9.5 GB in size. Once the template is copied, you are all set to start. 

Step 1: 
Run create_clustered_testvms.ps1 
This will create clustered testvms on each of the nodes. It will be done in such a way that VMs on NODE-01 will be stored on Volume1, VMs on NODE-02 will be stored on Volume2 and so on 

Step 2:
Run start_all_testvms.ps1 
This will start all the testvms

Step 3:
Wait for a few seconds to ensure all the testvms are booted properly; then run io_stress_trigger.ps1 and provide necessary input parameters 


Step 4:
You can watch IOPS of the cluster using watch_iops_live.ps1


If you would like to live migrate some testvms while the stress test is running you can try it and observe the IO variations. But before running the io_stress_trigger.ps1 again you have to move/ migrate all those testvms back to their preferred owners. This can be done using rebalance_all_testvms.ps1 .  

If any testvms are not running on their preferred owner, then io_stress_trigger.ps1 will fail for those VMs. Here, testvms running on NODE-01 has preferred owner NODE-01, similarly for all other testvms. So you have to make sure all the testvms are running on their preferred owner before starting io stress script.

Use stop_all_testvms.ps1 to shutdown all the clustered testvms that you created on step 1. To delete all the testvms, you can use wipeoff_testvms.ps1 .

NOTE: While running scripts 2,3,6 and 7 please make sure all the testvms are running on their preferred owner. Use rebalance_all_testvms.ps1 to assign all testvms back to its preferred owner! Also please run all these scripts on PowerShell with elevated privileges after directly logging into any of the cluster nodes.

All codes given below. It might not be optimal but I am pretty sure it works! Cheers !
--------------------------------------------------------------------------------------------------------------------------

#BEGIN_create_clustered_testvms.ps1
#Get cluster info
$Cluster_name = (Get-Cluster).name
$Nodes_name = (Get-ClusterNode).name
$Node_count = (Get-ClusterNode).count

#Input VM config
$VM_count = Read-Host "Enter number of VMs/ node"
$Cluster_VM_count = $VM_count*$Node_count
[int64]$RAM = Read-Host "Enter memory for each VM in MB Eg: 4096"
$RAM = 1MB*$RAM
$CPU = Read-Host "Enter CPU for each VM"

#Creds to Enter-PSSession
$pass = convertto-securestring -asplaintext -force -string Pass1234
$cred = new-object -typename system.management.automation.pscredential -argumentlist "administrator", $pass

#Loop for each node in cluster
for($i=1; $i -le $Node_count; $i++){
    $VM_path = "C:\ClusterStorage\Volume$i"
    $Node = $Nodes_name[$i-1]

    #Remote session to each node
    $S1 = New-PSSession -ComputerName $Node -Credential $cred

    #Loop for creating new testvms on each node
    for($j=1; $j -le $VM_count; $j++){
        $VM_name = "testvm-$Node-$j"
        new-vm -name $VM_name -computername $Node -memorystartupbytes $RAM -generation 2 -Path $VM_path
        set-vm -name $VM_name -ProcessorCount $CPU -ComputerName $Node
        New-Item -path $VM_path\$VM_name -name "Virtual Hard Disks" -type directory

        #Copy template disk
        Copy-Item "C:\ClusterStorage\Volume1\template\template.vhdx" -Destination "$VM_path\$VM_name\Virtual Hard Disks" -Verbose
        Add-VMHardDiskDrive -VMName $VM_name -ComputerName $Node -path "$VM_path\$VM_name\Virtual Hard Disks\template.vhdx" -Verbose

        #Create new fixed test disk
        New-VHD -Path "$VM_path\$VM_name\Virtual Hard Disks\test_disk.vhdx" -Fixed -SizeBytes 40GB
        Add-VMHardDiskDrive -VMName $VM_name -ComputerName $Node -path "$VM_path\$VM_name\Virtual Hard Disks\test_disk.vhdx" -Verbose

        Get-VM -ComputerName $Node -VMName $VM_name | Start-VM
        Add-ClusterVirtualMachineRole -VirtualMachine $VM_name
        Set-ClusterOwnerNode -Group $VM_name -owner $Node
        Start-Sleep -S 10

        #Remote session to each testvm on the node to initialize and format test disk (drive D:)
        Invoke-Command -Session $S1 -ScriptBlock {param($VM_name2,$cred2) Invoke-Command -VMName $VM_name2 -Credential $cred2 -ScriptBlock {
            Initialize-Disk -Number 1 -PartitionStyle MBR
            New-Partition -DiskNumber 1 -UseMaximumSize -DriveLetter D
            Get-Volume | where DriveLetter -eq D | Format-Volume -FileSystem NTFS -NewFileSystemLabel Test_disk -confirm:$false
            }} -ArgumentList $VM_name,$cred

        Start-Sleep -S 5
        Get-VM -ComputerName $Node -VMName $VM_name | Stop-VM -Force
        }
    }
#END_create_clustered_testvms.ps1


--------------------------------------------------------------------------------------------------------------------------

#BEGIN_start_all_testvms.ps1
#Get cluster info
$Cluster_name = (Get-Cluster).name
$Nodes_name = (Get-ClusterNode).name
$Node_count = (Get-ClusterNode).count

for($i=1; $i -le $Node_count; $i++){
    $Node = $Nodes_name[$i-1]
    Get-VM -ComputerName $Node -VMName "testvm-$Node*" | Start-VM -AsJob

    }
#END_start_all_testvms.ps1


--------------------------------------------------------------------------------------------------------------------------

#BEGIN_io_stress_trigger.ps1
#Get cluster info
$Cluster_name = (Get-Cluster).name
$Nodes_name = (Get-ClusterNode).name
$Node_count = (Get-ClusterNode).count

#Creds to Enter-PSSession
$pass = convertto-securestring -asplaintext -force -string Pass1234
$cred = new-object -typename system.management.automation.pscredential -argumentlist "administrator", $pass

$time = Read-Host "Enter duration of stress in seconds (Eg: 300)"
$block_size = Read-Host "Enter block size (Eg: 4K)"
$writes = Read-Host "Enter write percentage (Eg: 20)"
$OIO = Read-Host "Enter number of outstanding IOs (Eg: 16)"
$threads = Read-Host "Enter number of threads (Eg: 2)"

#Loop for each node in cluster
for($i=1; $i -le $Node_count; $i++){
    $VM_path = "C:\ClusterStorage\Volume$i"
    $Node = $Nodes_name[$i-1]

    #Remote session to each node
    $S1 = New-PSSession -ComputerName $Node -Credential $cred

    $VM_count = (Get-VM -ComputerName $Node -VMName "testvm-$Node*").Count

    #Loop for creating new testvms on each node
    for($j=1; $j -le $VM_count; $j++){
        $VM_name = "testvm-$Node-$j"

        #Remote session to each testvm
        Invoke-Command -Session $S1 -ScriptBlock {param($VM_name2,$cred2,$time1,$block_size1,$writes1,$OIO1,$threads1) Invoke-Command -VMName $VM_name2 -Credential $cred2 -ScriptBlock {param($time2,$block_size2,$writes2,$OIO2,$threads2)
        C:\diskspd.exe -"b$block_size2" -"d$time2" -"t$threads2" -"o$OIO2" -h -r -"w$writes2" -L -Z500M -c38G D:\io_stress.dat
        } -AsJob -ArgumentList $time1,$block_size1,$writes1,$OIO1,$threads1 } -ArgumentList $VM_name,$cred,$time,$block_size,$writes,$OIO,$threads


        }
    }
#END_io_stress_trigger.ps1


--------------------------------------------------------------------------------------------------------------------------

#BEGIN_rebalance_all_testvms.ps1
$clustergroups = Get-ClusterGroup | Where-Object {$_.IsCoreGroup -eq $false}
 foreach ($cg in $clustergroups)
 {
     $CGName = $cg.Name
     Write-Host "`nWorking on $CGName"
     $CurrentOwner = $cg.OwnerNode.Name
     $POCount = (($cg | Get-ClusterOwnerNode).OwnerNodes).Count
     if ($POCount -eq 0)
     {
         Write-Host "Info: $CGName doesn't have a preferred owner!" -ForegroundColor Magenta
     }
     else
     {
         $PreferredOwner = ($cg | Get-ClusterOwnerNode).Ownernodes[0].Name
         if ($CurrentOwner -ne $PreferredOwner)
         {
             Write-Host "Moving resource to $PreferredOwner, please wait..."
             $cg | Move-ClusterVirtualMachineRole -MigrationType Live -Node $PreferredOwner
         }
         else
         {
             write-host "Resource is already on preferred owner! ($PreferredOwner)"
         }
     }
 }
 Write-Host "`n`nFinished. Current distribution: "

 Get-ClusterGroup | Where-Object {$_.IsCoreGroup -eq $false} 
#END_rebalance_all_testvms.ps1


--------------------------------------------------------------------------------------------------------------------------

#BEGIN_watch_iops_live.ps1
#Get cluster info
$Cluster_name = (Get-Cluster).name
$Nodes_name = (Get-ClusterNode).name

while($true)
{

    [int]$total_IO = 0
    [int]$total_readIO = 0
    [int]$total_writeIO = 0
 
    clear
     
    "{0,-15} {1,-15} {2,-15} {3,-15} {4, -15} {5, -15}" -f "Host", "Total IOPS", "Reads/Sec", "Writes/Sec", "Read Q Length", "Write Q Length"

    for($j=1; $j -le $Nodes_name.count; $j++){

        $Node = $Nodes_name[$j-1]

        $Data = Get-CimInstance -ClassName Win32_PerfFormattedData_CsvFsPerfProvider_ClusterCSVFS -ComputerName $Node | Where Name -like Volume$j

        [int]$T = $Data.ReadsPerSec+$Data.WritesPerSec
     
        "{0,-15} {1,-15} {2,-15} {3,-15} {4,-15} {5, -15}" -f "$Node", "$T", $Data.ReadsPerSec, $Data.WritesPerSec, $Data.CurrentReadQueueLength, $Data.CurrentWriteQueueLength

        $total_IO = $total_IO+$T
        $total_readIO = $total_readIO+$Data.ReadsPerSec
        $total_writeIO = $total_writeIO+$Data.WritesPerSec
        }

    echo `n
    "{0,-15} {1,-15} {2,-15} {3,-15} " -f "Cluster IOPS", "$total_IO", "$total_readIO", "$total_writeIO"

    Start-Sleep -Seconds 3

}
#END_watch_iops_live.ps1

--------------------------------------------------------------------------------------------------------------------------

#BEGIN_stop_all_testvms.ps1
#Get cluster info
$Cluster_name = (Get-Cluster).name
$Nodes_name = (Get-ClusterNode).name
$Node_count = (Get-ClusterNode).count

for($i=1; $i -le $Node_count; $i++){
    $Node = $Nodes_name[$i-1]
    Get-VM -ComputerName $Node -VMName "testvm-$Node*" | Stop-VM -Force -AsJob
    }
#END_stop_all_testvms.ps1

--------------------------------------------------------------------------------------------------------------------------

#BEGIN_wipeoff_testvms.ps1
#Get cluster info
$Cluster_name = (Get-Cluster).name
$Nodes_name = (Get-ClusterNode).name
$Node_count = (Get-ClusterNode).count

#Loop for each node in cluster
for($i=1; $i -le $Node_count; $i++){
    $VM_path = "C:\ClusterStorage\Volume$i"
    $Node = $Nodes_name[$i-1]

    $VM_count = (get-vm -ComputerName $Node -Name "testvm-$Node-*").Count

    #Loop to delete testvm on each node
    for($j=1; $j -le $VM_count; $j++){

        $VM_name = "testvm-$Node-$j"
        $full_path = "$VM_path\$VM_name"

        Get-VM -Computername $Node -VMname $VM_name | stop-vm -force
        Get-ClusterGroup $VM_name | Remove-ClusterGroup -Force -RemoveResources
        Get-VM -Computername $Node -VMname $VM_name | remove-vm -force
        Remove-Item $full_path -Force -Recurse -ErrorAction SilentlyContinue -Verbose
        }

    }
#END_wipeoff_testvms.ps1

--------------------------------------------------------------------------------------------------------------------------


Tuesday, February 28, 2017

Stress test your storage system using iometer

In this article I will explain briefly about how to use iometer for simulating I/O load. Here in my test a 600GB LUN is provisioned from a Compellent storage array and connected to an ESXI 6.5 server as a data store. I've created a VM with 2 disks (C and E for OS and data) on the 600GB data store. We will be using drive E (40 GB) for the test with NTFS partition having 4KB allocation unit size.

Parameters:

Disk Workers - 2 (that means 2 worker threads will run simultaneously during the test)
Disk Targets - Select drive E on both disk workers
Maximum Disk Size - 0 (entire drive E will be used for the test)
Rest all values - default


Network Targets - leave the settings as it is (as we are not doing network stress)

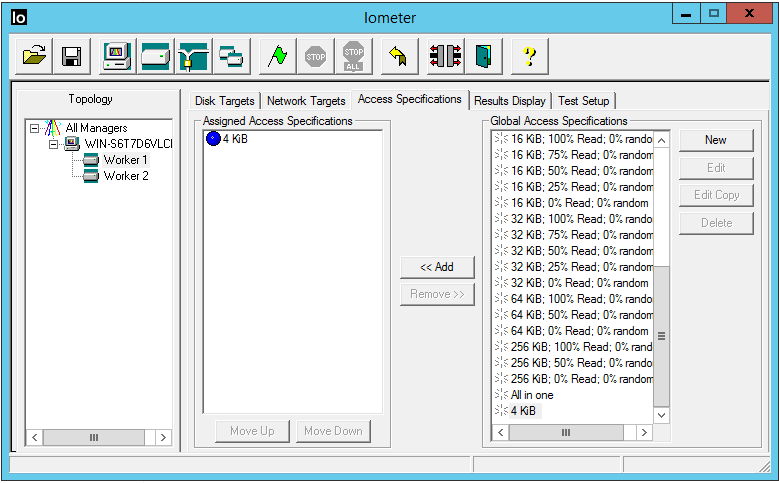
Access Specifications - it specifies the read/ write block size, percentage of read/ write, random/ sequential access etc.

Max IOPS at - 512 bytes transfer request size, 100% sequential, 100% reads
Max throughput at - 64K transfer request size, 100% sequential, 100% reads

In a real world situation it totally depends on the type of workloads. Here we are considering 4KB blocks, with 90% write, 10% read and 100% random access. These values are close to and are applicable to most virtualization workloads. 


Note: Make sure you add access specifications to all the disk workers

Transfer Request Size - 4KB
Percent Random/ Sequential Distribution - 100% Random
Percent Read/ Write Distribution - 90% Write
Rest all values - default


Once all the above settings are configured, you can click the green flag on the top to start the test. Now when you start it, you can see a test file (iobw.tst) will be created in drive E which will grow to the entire size of the disk (approx. 40GB). This is shown in the screenshots below.

Note: For creating a 40GB test file it takes few minutes

On the results display tab, set update frequency to 1 second to view real time results. You can also use the performance monitor tools to view disk reads and writes to cross check with the values of iometer.

Total I/Os per second = disk reads/ sec + disk writes/ sec


You can also monitor read/ write operations of your data store as shown below. These values should also match the results obtained from iometer and perfmon (as there is only one VM on this data store). In the below graph you can see the data store was almost idle as there was no operations on it. The moment I started iometer, it is creating iobw.tst file which is basically a 40GB write operation on drive E.


4KB reads and writes will happen on this test file (iobw.tst).


There is one more way you can monitor the IOPS value. While the iometer is running open resource monitor and observe disk activity generated by dynamo.exe. Make a note of total bytes. Convert it to Kilobytes and divide it by 4. This gives you the total IOPS which also should be close to values generated by iometer which is shown below.


ESXI performance graph is also shown below.


Final results:

iometer - 3799 IOPS
Perfmon - 372 + 3344 = 3716 IOPS
Disk activity monitor - (15291932 Bytes) 14933KB/ 4KB = 3733 IOPS
ESXI performance monitor - 373 + 3365 = 3738 IOPS

Note: To simulate a complex real world scenario or to benchmark your storage system you can provision multiple LUNs from the storage array, host few virtual machines on those LUNs and run iometer with different access specifications.  

Hope this article was useful to you. Cheers.