Showing posts with label Cloud-native. Show all posts

Sunday, October 29, 2023

Kubernetes 101 - Part12 - Debug pod

When it comes to troubleshooting application connectivity and name resolution issues in Kubernetes, having the right tools at your disposal can make all the difference. One of the most common challenges is accessing essential utilities like ping, nslookup, dig, traceroute, and more. To simplify this process, we've created a container image that packs a range of these utilities, making it easy to quickly identify and resolve connectivity issues.


The Container Image: A Swiss Army Knife for Troubleshooting

This container image, designed specifically for Kubernetes troubleshooting, comes pre-installed with the following essential utilities:

  1. ping: A classic network diagnostic tool for testing connectivity.
  2. dig: A DNS lookup tool for resolving domain names to IP addresses.
  3. nslookup: A network troubleshooting tool for resolving hostnames to IP addresses.
  4. traceroute: A network diagnostic tool for tracing the path of packets across a network.
  5. curl: A command-line tool for transferring data to and from a web server using HTTP, HTTPS, SCP, SFTP, TFTP, and more.
  6. wget: A command-line tool for downloading files from the web.
  7. nc: A command-line tool for reading and writing data to a network socket.
  8. netstat: A command-line tool for displaying network connections, routing tables, and interface statistics.
  9. ifconfig: A command-line tool for configuring network interfaces.
  10. route: A command-line tool for displaying and modifying the IP routing table.
  11. host: A command-line tool for performing DNS lookups and resolving hostnames.
  12. arp: A command-line tool for displaying and modifying the ARP cache.
  13. iostat: A command-line tool for displaying disk I/O statistics.
  14. top: A command-line tool for displaying system resource usage.
  15. free: A command-line tool for displaying free memory and swap space.
  16. vmstat: A command-line tool for displaying virtual memory statistics.
  17. pmap: A command-line tool for displaying process memory maps.
  18. mpstat: A command-line tool for displaying multiprocessor statistics.
  19. python3: A programming language and interpreter.
  20. pip: A package installer for Python.


Run as a pod on Kubernetes

kubectl run debug --image=vineethac/debug -n default -- sleep infinity


Exec into the debug pod

kubectl exec -it debug -n default -- bash 
root@debug:/# ping 8.8.8.8 PING 8.8.8.8 (8.8.8.8) 56(84) bytes of data. 64 bytes from 8.8.8.8: icmp_seq=1 ttl=46 time=49.3 ms 64 bytes from 8.8.8.8: icmp_seq=2 ttl=45 time=57.4 ms 64 bytes from 8.8.8.8: icmp_seq=3 ttl=46 time=49.4 ms ^C --- 8.8.8.8 ping statistics --- 3 packets transmitted, 3 received, 0% packet loss, time 2003ms rtt min/avg/max/mdev = 49.334/52.030/57.404/3.799 ms root@debug:/#
root@debug:/# nslookup google.com Server: 10.96.0.10 Address: 10.96.0.10#53 Non-authoritative answer: Name: google.com Address: 142.250.72.206 Name: google.com Address: 2607:f8b0:4005:80c::200e root@debug:/# exit exit ❯


Reference

https://github.com/vineethac/Docker/tree/main/debug-image

By having these essential utilities at your fingertips, you'll be better equipped to quickly identify and resolve connectivity issues in your Kubernetes cluster, saving you time and reducing the complexity of troubleshooting.

Hope it was useful. Cheers!

Sunday, July 23, 2023

Kubernetes 101 - Part11 - Find Kubernetes nodes with DiskPressure

Following are two quick and easy ways to find Kubernetes nodes with disk pressure:

jq:


kubectl get nodes -o json | jq -r '.items[] | select(.status.conditions[].reason=="KubeletHasDiskPressure") | .metadata.name'


jsonpath:


kubectl get nodes -o jsonpath='{range .items[*]} {.metadata.name} {" "} {.status.conditions[?(@.type=="DiskPressure")].status} {" "} {"\n"}'


❯ kubectl get no
NAME                                 STATUS   ROLES                  AGE     VERSION
tkc-btvsm-72hz2                      Ready    control-plane,master   124d    v1.23.8+vmware.3
tkc-btvsm-79xtn                      Ready    control-plane,master   124d    v1.23.8+vmware.3
tkc-btvsm-klmjz                      Ready    control-plane,master   124d    v1.23.8+vmware.3
tkc-workers-2cmvm-5bfcc5c9cd-gmv6m   Ready    <none>                 5d17h   v1.23.8+vmware.3
tkc-workers-2cmvm-5bfcc5c9cd-m44sq   Ready    <none>                 5d17h   v1.23.8+vmware.3
tkc-workers-2cmvm-5bfcc5c9cd-mjjlk   Ready    <none>                 5d17h   v1.23.8+vmware.3
tkc-workers-2cmvm-5bfcc5c9cd-wflrl   Ready    <none>                 5d17h   v1.23.8+vmware.3
tkc-workers-2cmvm-5bfcc5c9cd-xnqvk   Ready    <none>                 5d17h   v1.23.8+vmware.3
❯
❯
❯ kubectl get nodes -o json | jq -r '.items[] | select(.status.conditions[].reason=="KubeletHasDiskPressure") | .metadata.name'
tkc-workers-2cmvm-5bfcc5c9cd-m44sq
tkc-workers-2cmvm-5bfcc5c9cd-wflrl
❯
❯ kubectl get nodes -o jsonpath='{range .items[*]} {.metadata.name} {" "} {.status.conditions[?(@.type=="DiskPressure")].status} {" "} {"\n"}'
 tkc-btvsm-72hz2   False
 tkc-btvsm-79xtn   False
 tkc-btvsm-klmjz   False
 tkc-workers-2cmvm-5bfcc5c9cd-gmv6m   False
 tkc-workers-2cmvm-5bfcc5c9cd-m44sq   True
 tkc-workers-2cmvm-5bfcc5c9cd-mjjlk   False
 tkc-workers-2cmvm-5bfcc5c9cd-wflrl   True
 tkc-workers-2cmvm-5bfcc5c9cd-xnqvk   False
 %
❯

Hope it was useful. Cheers!

Sunday, May 7, 2023

Kubernetes 101 - Part9 - kubeconfig certificate expiration

You can verify the expiration date of kubeconfig in the current context as follows:

kubectl config view --minify --raw --output 'jsonpath={..user.client-certificate-data}' | base64 -d | openssl x509 -noout -enddate

❯ k config current-context
sc2-01-vcxx

❯ kubectl config view --minify --raw --output 'jsonpath={..user.client-certificate-data}' | base64 -d | openssl x509 -noout -enddate
notAfter=Sep 6 05:13:47 2023 GMT

❯ date
Thu Sep 7 18:05:52 IST 2023


Hope it was useful. Cheers!

Saturday, April 15, 2023

Kubernetes 101 - Part8 - Filter events of a specific object

You can filter events of a specific object as follows:

k get event --field-selector involvedObject.name=<object name> -n <namespace>

➜  k get pods
NAME                    READY   STATUS             RESTARTS   AGE
new-replica-set-rx7vk   0/1     ImagePullBackOff   0          101s
new-replica-set-gsxxx   0/1     ImagePullBackOff   0          101s
new-replica-set-j6xcp   0/1     ImagePullBackOff   0          101s
new-replica-set-q8jz5   0/1     ErrImagePull       0          101s

➜  k get event --field-selector involvedObject.name=new-replica-set-q8jz5 -n default
LAST SEEN   TYPE      REASON      OBJECT                      MESSAGE
3m53s       Normal    Scheduled   pod/new-replica-set-q8jz5   Successfully assigned default/new-replica-set-q8jz5 to controlplane
2m33s       Normal    Pulling     pod/new-replica-set-q8jz5   Pulling image "busybox777"
2m33s       Warning   Failed      pod/new-replica-set-q8jz5   Failed to pull image "busybox777": rpc error: code = Unknown desc = failed to pull and unpack image "docker.io/library/busybox777:latest": failed to resolve reference "docker.io/library/busybox777:latest": pull access denied, repository does not exist or may require authorization: server message: insufficient_scope: authorization failed
2m33s       Warning   Failed      pod/new-replica-set-q8jz5   Error: ErrImagePull
2m3s        Warning   Failed      pod/new-replica-set-q8jz5   Error: ImagePullBackOff
110s        Normal    BackOff     pod/new-replica-set-q8jz5   Back-off pulling image "busybox777"

Hope it was useful. Cheers!

Saturday, March 18, 2023

Kubernetes 101 - Part7 - Restart all deployments and daemonsets in a namespace

Restart all deployments in a namespace

❯ kubectl rollout restart deployments -n <namespace>

Restart all daemonsets in a namespace

❯ kubectl rollout restart daemonsets -n <namespace>


Hope it was useful. Cheers!

Friday, March 10, 2023

Kubernetes 101 - Part6 - Get static pods

Static pods are directly managed by the kubelet on a specific node. More about static pods can be found here: https://kubernetes.io/docs/tasks/configure-pod-container/static-pod/

In this post we will take a look at how to find all static pods in a Kubernetes cluster. For a static pod the owner reference kind will be Node.

custom-columns:

❯ kubectl get pods --all-namespaces -o custom-columns=NAME:.metadata.name,CONTROLLER:'.metadata.ownerReferences[].kind',NAMESPACE:.metadata.namespace | grep Node

❯ kubectl get pods --all-namespaces -o custom-columns=NAME:.metadata.name,CONTROLLER:'.metadata.ownerReferences[].kind',NAMESPACE:.metadata.namespace | grep Node | wc -l
jsonpath:
❯ kubectl get pods -A -o=jsonpath='{.items[*].metadata.ownerReferences[?(@.kind=="Node")]}'

❯ kubectl get pods -A -o=jsonpath='{.items[*].metadata.ownerReferences[?(@.kind=="Node")]}' | jq

❯ kubectl get pods -A -o=jsonpath='{.items[*].metadata.ownerReferences[?(@.kind=="Node")]}' | jq | grep Node | wc -l
Hope it was useful. Cheers!

Saturday, February 19, 2022

Kubernetes 101 - Part5 - Removing namespaces stuck in terminating state

Namespaces getting stuck at terminating state is one of the common issues I have seen while working with K8s. Here is an example namespace in terminating state and you can see there are no resources under it. In this case we are removing this namespace by setting the finalizers to null.

% kg ns rohitgu-intelligence-cluster-6
NAME                             STATUS        AGE
rohitgu-intelligence-cluster-6   Terminating   188d

% kg pods,tkc,all,cluster-api -n rohitgu-intelligence-cluster-6
No resources found in rohitgu-intelligence-cluster-6 namespace.

% kg ns rohitgu-intelligence-cluster-6 -o json > rohitgu-intelligence-cluster-6-json

% jq '.spec.finalizers = [] | .metadata.finalizers = []' rohitgu-intelligence-cluster-6-json > rohitgu-intelligence-cluster-6-json-nofinalizer

% cat rohitgu-intelligence-cluster-6-json-nofinalizer
{
  "apiVersion": "v1",
  "kind": "Namespace",
  "metadata": {
    "annotations": {
      "calaxxxxx.xxxx.com/ccsrole-created": "true",
      "calaxxxxx.xxxx.com/owner": "rohitgu",
      "calaxxxxx.xxxx.com/user-namespace": "rohitgu",
      "ls_id-0": "e28442b5-ace0-4e20-b5a0-c32bc72427d9",
      "ncp/extpoolid": "domain-c1034:02cde809-99d1-423e-aac9-014889740308-ippool-10-186-120-1-10-186-123-254",
      "ncp/router_id": "t1_87d44fc8-ac60-441a-8e35-509ff31a4eba_rtr",
      "ncp/snat_ip": "10.186.120.40",
      "ncp/subnet-0": "172.29.1.144/28",
      "vmware-system-resource-pool": "resgroup-663809",
      "vmware-system-vm-folder": "group-v663810"
    },
    "creationTimestamp": "2021-08-26T09:11:39Z",
    "deletionTimestamp": "2022-03-02T07:16:27Z",
    "labels": {
      "kubernetes.io/metadata.name": "rohitgu-intelligence-cluster-6",
      "vSphereClusterID": "domain-c1034"
    },
    "name": "rohitgu-intelligence-cluster-6",
    "resourceVersion": "1133900371",
    "selfLink": "/api/v1/namespaces/rohitgu-intelligence-cluster-6",
    "uid": "87d44fc8-ac60-441a-8e35-509ff31a4eba",
    "finalizers": []
  },
  "spec": {
    "finalizers": []
  },
  "status": {
    "conditions": [
      {
        "lastTransitionTime": "2022-03-02T07:16:32Z",
        "message": "Discovery failed for some groups, 1 failing: unable to retrieve the complete list of server APIs: data.packaging.carvel.dev/v1alpha1: the server is currently unable to handle the request",
        "reason": "DiscoveryFailed",
        "status": "True",
        "type": "NamespaceDeletionDiscoveryFailure"
      },
      {
        "lastTransitionTime": "2022-03-02T07:16:56Z",
        "message": "All legacy kube types successfully parsed",
        "reason": "ParsedGroupVersions",
        "status": "False",
        "type": "NamespaceDeletionGroupVersionParsingFailure"
      },
      {
        "lastTransitionTime": "2022-03-02T07:16:56Z",
        "message": "All content successfully deleted, may be waiting on finalization",
        "reason": "ContentDeleted",
        "status": "False",
        "type": "NamespaceDeletionContentFailure"
      },
      {
        "lastTransitionTime": "2022-03-02T07:23:22Z",
        "message": "All content successfully removed",
        "reason": "ContentRemoved",
        "status": "False",
        "type": "NamespaceContentRemaining"
      },
      {
        "lastTransitionTime": "2022-03-02T07:23:22Z",
        "message": "All content-preserving finalizers finished",
        "reason": "ContentHasNoFinalizers",
        "status": "False",
        "type": "NamespaceFinalizersRemaining"
      }
    ],
    "phase": "Terminating"
  }
}

% kubectl replace --raw "/api/v1/namespaces/rohitgu-intelligence-cluster-6/finalize" -f rohitgu-intelligence-cluster-6-json-nofinalizer

% kg ns rohitgu-intelligence-cluster-6
Error from server (NotFound): namespaces "rohitgu-intelligence-cluster-6" not found

Hope it was useful. Cheers!

Friday, October 15, 2021

Kubernetes 101 - Part4 - Kubectl autocomplete and alias

You can use the following to enable auto-completion for kubectl on MAC.

ZSH

Run the following on your terminal:
% source <(kubectl completion zsh)

If you are getting the below error:
/dev/fd/11:2: command not found: compdef

You might need to activate the completion system. Run the following on your terminal:
% autoload -Uz compinit
% compinit


% source <(kubectl completion zsh)
% echo "[[ $commands[kubectl] ]] && source <(kubectl completion zsh)" >> ~/.zshrc

Now you can use tab for auto-completion of kubectl commands. 

Alias

You can create aliases and add them to your ~/.zshrc  file. Following are the aliases i use:

alias k="kubectl"
alias kg="kubectl get"
alias kge="kubectl get events"
alias kd="kubectl describe"
alias kgtkc='kubectl get tkc -A -o custom-columns=NAMESPACE:.metadata.namespace,NAME:.metadata.name,PHASE:status.phase,CREATIONTIME:metadata.creationTimestamp,VERSION:spec.distribution.fullVersion,CP:spec.topology.controlPlane.replicas,WORKER:status.totalWorkerReplicas --sort-by="metadata.creationTimestamp"'


After adding and saving the above in your ~/.zshrc file, make sure you relaunch the terminal. Now you are ready to use the aliases.

Example:

% kg tkc -n vineetha-test-node-dns
NAME   CONTROL PLANE   WORKER   TKR NAME                            AGE   READY   TKR COMPATIBLE   UPDATES AVAILABLE
gc     1               3        v1.19.14---vmware.1-tkg.1.8753786   68d   False   True             [1.20.9+vmware.1-tkg.1.a4cee5b]

% kgtkc | grep vineetha           
vineetha-test-node-dns            gc                            running    2021-09-28T08:39:56Z   v1.19.14+vmware.1-tkg.1.8753786   1     3

References

https://kubernetes.io/docs/reference/kubectl/cheatsheet/
https://unix.stackexchange.com/questions/339954/zsh-command-not-found-compinstall-compinit-compdef

Monday, June 21, 2021

Validate your Kubernetes cluster using Sonobuoy

Sonobuoy is a diagnostic tool that helps to validate the state of a Kubernetes cluster by running a set of tests in an accessible and non-destructive manner. By default, Sonobuoy runs the Kubernetes conformance tests. The conformance testing ensures that a cluster is properly configured and that its behavior conforms to official Kubernetes specifications. It also helps ensure that a Kubernetes cluster meets the minimal set of features. They are a subset of end-to-end (e2e) tests that should pass on any Kubernetes cluster. 

A conformance-passing cluster provides the guarantee that your Kubernetes is properly configured as per best practices. There are around 275 tests that need to be passed for qualifying Kubernetes conformance.

Install Sonobuoy

wget https://github.com/vmware-tanzu/sonobuoy/releases/download/v0.51.0/sonobuoy_0.51.0_linux_amd64.tar.gz
tar -xvf sonobuoy_0.51.0_linux_amd64.tar.gz

Note: I am installing Sonobuoy on CentOS Linux release 7.9.2009 (Core).


Help
/root/sonobuoy --help

Run Sonobuoy
/root/sonobuoy run --wait

Note: e2e test takes around 60-90 minutes to complete.


Sonobuoy Objects
kubectl get all -n sonobuoy


kubectl get pods -n sonobuoy -o wide


Sonobuoy Status
/root/sonobuoy status
/root/sonobuoy status --json
/root/sonobuoy status --json | jq

Note: If you are getting this while using jq "bash: jq: command not found..." , follow this blog to install jq.


Inspect Logs
/root/sonobuoy logs

Sonobuoy Results
results=$(/root/sonobuoy retrieve)


/root/sonobuoy results $results
/root/sonobuoy results <tar ball file>


See passed/ failed tests
/root/sonobuoy results <tar ball file> --mode=detailed | jq 'select(.status=="passed")' /root/sonobuoy results <tar ball file> --mode=detailed | jq 'select(.status=="failed")'


List the conformance tests
/root/sonobuoy results <tar ball file> --mode=detailed| jq 'select(.name | contains("[Conformance]"))'

Cleanup
/root/sonobuoy delete --wait


References

https://github.com/vmware-tanzu/sonobuoy
https://sonobuoy.io/docs/v0.51.0/


Saturday, January 23, 2021

Benchmarking Kubernetes infrastructure using K-Bench

K-Bench is a framework to benchmark the control and data plane aspects of a Kubernetes cluster. More details are available at https://github.com/vmware-tanzu/k-bench. In my case, I am going to conduct this benchmarking study on a Tanzu Kubernetes cluster which is provisioned using Tanzu Kubernetes Grid service on a vSphere 7 U1 cluster.

Step 1: Clone the K-Bench repo

git clone https://github.com/vmware-tanzu/k-bench.git


Step 2: Install

./install.sh


Once the installation is done it will say, "Completed k-bench installation.".

Step 3: Run the benchmark

./run.sh


If you don't specify any test, then it is going to conduct the default set of tests. All sets of tests are defined under the config directory. If you browse to the config directory and list, there are separate folders specific to each test. You can see folders starting with cp and dp, and it refers to control plane and data plane related tests.


If no specific test is mentioned, then it is going to run all that is defined in the default directory. You can also see details of the test and results in the logs. The directories starting with "results" will have log files corresponding to each test run.


Following is a sample log that shows a summary of pod creation throughput, pod creation average latency, pod startup total latency, list/ update/ delete pod latency, etc.


Now, if you want to run a specific test case, you can do it as follows:
Usage: ./run.sh -r <run-tag> [-t <comma-separated-tests> -o <output-dir>]
DP network internode test

For example, you can run a data plane test to check the network performance between two nodes as shown below.

./run.sh -r "kbench-run-on-tkg-cluster-02"  -t "dp_network_internode" -o "./"


As soon as you run the above command, two pods will be created inside "kbench-pod-namespace" on two worker nodes as you see below.


It will then start "iperf3" process inside those two pods to create a network load following a client-server model as per the actions defined in the config.json file.


Sample logs are given below. It shows details like the amount of data transferred, transfer rate, network latency, etc.


Once the test run is complete, the pods and other resources created will be automatically deleted. Similarly, you can select the other set of tests that are pre-defined in the framework. I believe you have the flexibility to define custom test cases too as per your requirements. I hope it was useful. Cheers!

Related posts


Storage performance benchmarking of Tanzu Kubernetes clusters
Monitoring Tanzu Kubernetes cluster using Prometheus and Grafana


References


Saturday, November 28, 2020

Storage performance benchmarking of Tanzu Kubernetes Clusters

Benchmarking of IT infrastructure is standard practice and is usually done before putting it into a production environment. It gives you baseline values about different performance aspects of the system/ solution under test. These benchmarking principles are applicable for Kubernetes clusters too. But the test cases and evaluation criteria may slightly vary compared to benchmarking a traditional IT infrastructure. 

Following are some of the test considerations:

  • Performance of PVCs.
    • Time to provision PVCs.
    • Read/ Write IOPS and Latency of PVCs.
  • Pod startup latency.
  • The time consumed to complete the deployment of different K8s objects.
    • Statefulset
    • Deployment etc.
  • Performance behavior of sample application workloads.
  • Network performance and connectivity between different K8s nodes.

In this article, I will explain a quick and easy way to benchmark the storage system used by the Kubernetes cluster to provision PVCs for application workloads. I am using FIO to generate storage IOs. You can use the following YAML file to deploy FIO pods as a statefulset. Note that here I am using PowerFlex VVOL datastore as Cloud Native Storage (CNS) for Tanzu K8s clusters and so the storage class "powerflex-storage-policy". This may differ in your case, and you might need to modify it to match the storage class available in your setup.


This YAML file will deploy a statefulset with 15 FIO pods (as per the number of replicas mentioned) and will start the storage IO stress test (8k block size, 70% random reads, 30% random writes, 2 jobs, 16 iodepth) on the attached PVC as and when the pod is started. Total 15 PVCs will be created in this case, and one PVC will get attached to one FIO pod. 

Note: If you get an error "forbidden: unable to validate against any pod security policy" after applying the above statefulset, then the pods will not get created. You will need to first create and apply Pod Security Policy (PSP) to the Tanzu Kubernetes Cluster.


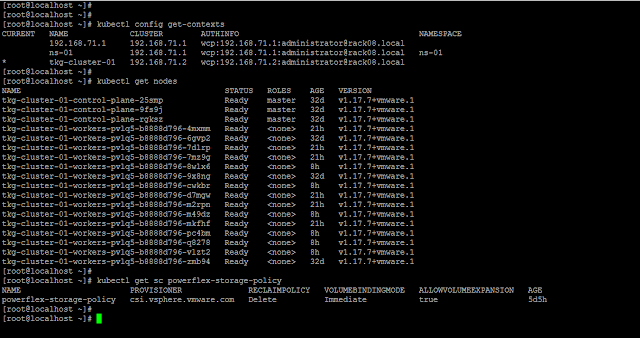
Following is an overview of my vSphere with Tanzu setup:

Tanzu K8s control plane nodes/ master VMs: 3
Tanzu K8s worker nodes/ VMs: 15


Contexts, Tanzu K8s cluster nodes, and storage class.


Create a statefulset using the above YAML file.
kubectl apply -f https://gist.githubusercontent.com/vineethac/7c9f6ce2b72868b8832a4404b79ebba2/raw/980f9d6c24c10b1b7b39b20d80c15a9f2ee6c4f1/fio_ss.yaml -n <namespace name>


You can see that it took roughly 6 minutes to deploy 15 FIO pods and corresponding PVCs. The time may vary depending on whether the FIO image is locally available on the nodes, available resources on the nodes, etc.  


As and when each pod is created, FIO will automatically start IO stress on it. IOs will be read/ written into the attached PVCs. As I mentioned earlier, I am using a storage class "powerflex-storage-policy" and this is associated with a VVOL datastore backed by a PowerFlex storage pool. In this case, all the PVCs are created in a PowerFlex VVOL datastore.


You can also see multiple volumes in the PowerFlex UI and all those volume names starting with "vasa" are externally managed by the PowerFlex VASA provider. The performance of each volume can be also be monitored using the PowerFlex UI.


If you would like to see the historical performance data, you can use vROps. Dell EMC has recently released a vROps management pack for PowerFlex systems. It is a monitoring and alerting solution that provides extensive visibility into the PowerFlex infrastructure. For monitoring K8s clusters and resources, you can use the vROps management pack for container monitoring


Note: When the duration mentioned in the FIO test is over, the pods will get restarted and the IO stress will also start. To modify the FIO parameters you can use kubectl edit statefulset fiopod-statefulset-multipod -n fiogit modify required parameters and save it. After saving it the new changes will get applied automatically. Once you are done with the testing, you can delete the statefulset and the corresponding PVCs using kubectl delete command. This method is useful when you want to test something quickly or if you have only less test profiles. If you have many test profiles with varying block sizes, iodepth, etc, then you will need to build a small script or something to automate the process. 

Hope it was useful. Cheers!


Related articles


References


Sunday, September 27, 2020

Monitoring Tanzu Kubernetes cluster using Prometheus and Grafana

Updated: June 26, 2021

In this post, we will see how to deploy Prometheus and Grafana using Helm and Prometheus Operator to monitor Tanzu Kubernetes clusters. 


Following is my Tanzu K8s cluster setup:


Install Helm 3

curl https://raw.githubusercontent.com/kubernetes/helm/master/scripts/get-helm-3 > get_helm.sh
chmod 700 get_helm.sh
./get_helm.sh

Install Prometheus Operator using Helm

helm repo add prometheus-community https://prometheus-community.github.io/helm-charts
helm repo update
helm install pro-mon -n pro-mon prometheus-community/kube-prometheus-stack


Verify all


Port forward Grafana to 3000 to access the dashboards


Login to Grafana using a web browser at localhost:3000/login .

The default username is "admin" and the password is "prom-operator".


Go to Dashboards - Manage to view/ access the list of out-of-the-box K8s dashboards. The following are some of the sample dashboards.


Kubernetes | Compute Resources | Namespace (Pods)


Kubernetes | Networking | Namespace (Pods)


Kubernetes | API server


This is not limited to just Tanzu K8s clusters. You can also monitor OpenShift and Upstream K8s clusters following this method. Hope it was useful. Cheers!

References


https://github.com/prometheus-community/helm-charts/tree/main/charts/kube-prometheus-stack
[www.bogotobogo.com] Docker_Kubernetes_Prometheus_Deploy_using_Helm_and_Prometheus_Operator

Saturday, August 15, 2020

Visualize your Kubernetes clusters and workloads using Octant

In this article, I will explain how to visualize your Kubernetes clusters and workload using Octant.   


Download Octant


You can download the latest release of Octant from https://github.com/vmware-tanzu/octant/releases.

Thursday, July 9, 2020

Tanzu Kubernetes Grid (TKG) on vSphere 6.7 U3 - Part3

In this blog, I will explain how to deploy an FIO application pod with persistent storage on your Tanzu Kubernetes workload cluster.

Step 1: Deploy a K8s workload cluster

tkg create cluster <cluster name> --plan=dev


Now the workload K8s cluster is deployed with a Master, LB, and Worker node.


Wednesday, June 24, 2020

Tanzu Kubernetes Grid (TKG) on vSphere 6.7 U3 - Part2

In this post, I will explain how to deploy and manage multiple Kubernetes workload clusters using TKG CLI.

To view the management cluster: tkg get management-cluster
To create a new workload cluster: tkg create cluster <cluster name> --plan=<cluster plan>


Now as per default dev plan one master, one worker, and a load balancer are deployed.


Tuesday, June 23, 2020

Tanzu Kubernetes Grid (TKG) on vSphere 6.7 U3 - Part1


TKG is an enterprise-ready Kubernetes runtime which provides a consistent, upstream-compatible implementation of Kubernetes, that is tested, signed, and supported by VMware. 

Installation

I am using a 3 node vSAN cluster running vSphere 6.7 U3 to deploy TKG. The first step is to prepare a VM that will be used to kickstart the deployment process. Here I am using a CentOS 7 VM with desktop UI. Download the TKG CLI, TKG Kubernetes OVA, and Load Balancer OVA from the following link:


I am using the following versions:
  • VMware Tanzu Kubernetes Grid CLI 1.1 Linux
  • VMware Tanzu Kubernetes Grid 1.1.0 Kubernetes v1.18.2 OVA
  • VMware Tanzu Kubernetes Grid 1.1 Load Balancer OVA

Unzip and install TKG CLI on the CentOS VM.

Friday, May 15, 2020

Kubernetes 101 - Part3 - Install kubectl on Windows

This article shows how to install kubectl on a Windows machine and connect to a remote Kubernetes cluster.

Open PowerShell as administrator and run the following:
Install-Script -Name install-kubectl -Scope CurrentUser -Force


This will download the installation files to Windows PowerShell script folder of the current user. In my case it is: C:\Users\vineetha\Documents\WindowsPowerShell\Scripts


Now browse to the above location in Powershell and execute the install-kubectl.ps1 file.
install-kubectl.ps1 [-DownloadLocation <path>]

Note: If you do not specify a DownloadLocationkubectl will be installed in the user's temp directory.