Showing posts with label troubleshooting. Show all posts

Saturday, October 18, 2025

Working with GPUs - Part1 - Using nvidia-smi

GPUs are the backbone of modern AI and HPC clusters, and understanding their basic health and configuration is the first step toward reliable operations. In this first post of the series, we start with nvidia-smi - the primary tool for discovering Nvidia GPUs, validating drivers and CUDA versions, and performing essential health checks. These fundamentals form the baseline for monitoring, performance benchmarking, and troubleshooting GPU compute nodes at scale.

Verify version 

nvidia-smi --version


List all GPUs 

nvidia-smi -L


Current state of every GPU

nvidia-smi


Following are the key observations from the above output:

  • All 8 GPUs detected (NVIDIA H100 80GB HBM3). Confirms full hardware enumeration. 
  • HBM3 memory present (80GB per GPU). Validates expected SKU (H100 SXM vs PCIe). This is important because SXM GPUs behave differently in power, cooling, and NVLink bandwidth; troubleshooting playbooks differ by form factor.
  • Driver version 550.90.07 with CUDA compatibility 12.4. This confirms a Hopper‑supported, production‑ready driver stack. Many issues (NCCL failures, DCGM errors, framework crashes) trace back to unsupported driver–CUDA combinations.
  • Persistence Mode: On. This avoids GPU driver reinitialization delays and flaky behavior between jobs. Turning this off in clusters can cause intermittent job start failures or longer warm‑up times.
  • Temperatures in 34–41 °C range at idle. This indicates healthy cooling and airflow. High idle temperatures point to heatsink issues, airflow obstructions, fan/BMC problems, or thermal paste degradation.
  • Performance State: P0 (highest performance). This shows GPUs are not power or thermally‑throttled. If GPUs remain in lower P‑states under load, suspect thermal limits, power caps, or firmware misconfigurations.
  • Power usage ~70–76 W with cap at 700 W. This confirms ample power headroom and no throttling. GPUs hitting the power cap during load may show reduced performance even when utilization appears high.
  • GPU utilization at 0% and no running processes. This confirms the node is idle and clean. Useful to rule out “ghost” workloads, leaked CUDA contexts, or stuck processes when diagnosing performance drops.
  • Memory usage ~1 MiB per GPU. Only driver bookkeeping allocations present. Any significant memory use at idle suggests leftover processes or failed container teardown.
  • Volatile Uncorrected ECC errors: 0. Confirms memory integrity. Any non‑zero uncorrected ECC errors are serious and usually justify isolating the GPU and starting RMA/vendor diagnostics.
  • MIG mode: Disabled. Ensures full GPU and NVLink bandwidth availability. MIG partitions can severely impact NCCL and large‑model training if enabled unintentionally.
  • Compute mode: Default. Allows multiple processes (expected in shared clusters). Exclusive modes can cause unexpected job failures or scheduling issues.
  • Fan: N/A (SXM platform). Normal for chassis‑controlled cooling. Fan values appearing unexpectedly may indicate incorrect sensor readings or platform misidentification.


Health metrics of all GPUs


nvidia-smi -q

This shows details like:
  • Serial Number
  • VBIOS Version
  • GPU Part Number
  • Utilization
  • ECC Errors
  • Temperature, etc.

Query GPU health metrics


Help: nvidia-smi --help-query-gpu

GPU memory usage and utilization: nvidia-smi --query-gpu=index,name,uuid,driver_version,memory.total,memory.used,utilization.gpu --format=csv


GPU temperature status: nvidia-smi --query-gpu=index,name,uuid,temperature.gpu,temperature.gpu.tlimit,temperature.memory --format=csv


GPU reset state: nvidia-smi --query-gpu=index,name,uuid,reset_status.reset_required,reset_status.drain_and_reset_recommended --format=csv


  • reset_status.reset_required - indicates whether the GPU must be reset to return to a clean operational state.
  • reset_status.drain_and_reset_recommended - Yes, indicates GPU/ node should be drained first, then reset. No, indicates reset can be done immediately.
  • Note: In production GPU clusters based on Kubernetes, the safest and recommended practice is to always drain the node before attempting GPU recovery. For H100 SXM systems, recovery is performed via node reboot, not individual GPU resets.


NVLink topology

nvidia-smi topo -m


Note: Any non‑NVLink GPU‑to‑GPU path on H100 SXM immediately explains poor NCCL performance and requires hardware correction.

nvidia-smi nvlink -s         # shows per direction (Tx or Rx) bandwidth of all nvlinks of all GPUs

nvidia-smi nvlink -s -i 0 # shows per direction (Tx or Rx) bandwidth of all nvlinks of the GPU 0


Hope it was useful. Cheers!

Friday, August 15, 2025

Understanding NUMA: Its Impact on VM Performance in ESXi

VMware ESXi hosts use Non-Uniform Memory Access (NUMA) architecture to optimize CPU and memory locality. Each NUMA node consists of a subset of CPUs and memory. Accessing local memory within the same NUMA node is significantly faster than remote memory access. Misaligned NUMA configurations can lead to latency spikes, increased CPU Ready Time, and degraded VM performance.


Key symptoms

The common symptoms for Virtual Machines (VMs) on ESXi that have a misconfigured or misaligned Non-Uniform Memory Access (NUMA) configuration primarily manifest as performance degradation and latency. The main issue caused by NUMA misalignment is that the VM's vCPUs end up frequently having to access memory that belongs to a different physical NUMA node on the ESXi host (known as Remote Access), which is significantly slower than accessing local memory.

The resulting symptoms for the VM include:

  • Overall Slowness and Unresponsiveness: Services and applications running inside the guest OS may respond slowly or intermittently. The entire VM can feel sluggish.

  • High CPU Ready Time (%RDY): This is the most critical ESXi-level metric. CPU Ready Time represents the percentage of time a VM was ready to run but could not be scheduled on a physical CPU. High %RDY times (often above 5% or 10%) can indicate that the VM's vCPUs are struggling to get scheduled efficiently, which happens when they are spread across multiple NUMA nodes (NUMA spanning).

  • Excessive Remote Memory Access: When a VM consumes more vCPUs or memory than is available on a single physical NUMA node, a portion of its memory traffic becomes "remote." You can check this using the esxtop utility on the ESXi host.

Common misconfigurations


Misalignment often occurs when the VM's vCPU and memory settings exceed the resources of a single physical NUMA node on the host. Common causes include:

  • Over-Sized VM: Allocating more vCPUs than the physical cores available in a single physical NUMA node or allocating more memory than the physical memory on a single NUMA node.
  • Hot-Add Features: Enabling CPU Hot-Add or Memory Hot-Add can disable vNUMA (Virtual NUMA) for the VM, preventing the VMkernel from presenting an optimized NUMA topology to the guest OS.
  • Incorrect Cores per Socket Setting: While vSphere 6.5 and later are smarter about vNUMA, configuring the Cores per Socket value manually in a way that doesn't align with the host's physical NUMA topology can still lead to poor scheduling and memory placement, particularly when licensing dictates a low number of virtual sockets.
  • Setting VM Limits: Setting a memory limit on a VM that is lower than its configured memory can force the VMkernel to allocate the remaining memory from a remote NUMA node.

Check NUMA assignments in ESXi

  • SSH into the ESXi node.
  • Issue the esxtop command and press m for memory view, then press f to enable the fields, G to enable NUMA information.

  • You should be able to view the NUMA related information like NRMEM, NLMEM, and N%L.
    • NRMEM (MB): NUMA Remote MEMory
      • This is the current amount of a VM's memory (in MB) that is physically located on a remote NUMA node relative to where the VM's vCPUs are currently running.
      • High NRMEM indicates NUMA locality issues, meaning the vCPUs must cross the high-speed interconnect (like Intel's QPI/UPI or AMD's Infinity Fabric) to access some of their data, which results in slower performance.
    • NLMEM (MB): NUMA Local MEMory
      • This is the current amount of a VM's memory (in MB) that is physically located on the local NUMA node, meaning it's on the same physical node as the vCPUs accessing it.
      • The ESXi NUMA scheduler's goal is to maximize NLMEM to ensure fast memory access.
    • N%L: NUMA % Locality
      • This is the percentage of the VM's total memory that resides on the local NUMA node.
      • A value close to 100% is ideal, indicating excellent memory locality. If this value drops below 80%, the VM may experience poor NUMA locality and potential performance issues due to slower remote memory access.
  • Issue the esxtop command and press v to see the virtual machine screen.
  • From the virtual machine screen note down the GID of the VM under consideration, and press q to exit the screen.
  • Now issue the sched-stats -t numa-clients command. This will list down NUMA details of the VM. Check the groupID column to match the GID of the VM.
  • For example, the GID of the VM I am looking at is 7886858. This is a 112 CPU VM which is running on an 8-socket physical host.

  • You can see the VM is spread/ placed under NUMA nodes 0, 1, 2, and 3.
  • The remoteMem is 0, for each of these NUMA nodes, which means they are accessing all the local memory of the NUMA node.
  • To view physical NUMA details of the ESXI you can use sched-stats -t numa-pnode command. You can see this server has 8 NUMA nodes.
  • To view the NUMA latency, you can use the sched-stats -t numa-latency command.

Verify NUMA node details at guest OS


Windows
  • Easiest way is to go to Task Manager - Performance - CPU
    • Right click on the CPU utilization graph and select Change graph to - NUMA nodes
    • If there only one NUMA node, you may notice the option as greyed out.
  • To get detailed info you can consider using the sysinternals utility coreinfo64.

Linux
  • To view NUMA related details from the Linux guest OS layer, you can use the following commands:
lscpu | grep -i NUMA
dmesg | grep -i NUMA

Remediation


The most common remediation steps for fixing Non-Uniform Memory Access (NUMA) related performance issues in ESXi VMs revolve around right-sizing the VM to align its resources with the physical NUMA boundaries of the host.

The primary goal is to minimize Remote Memory Access (NRMEM) and maximize Local Memory Access (N%L). The vast majority of NUMA issues stem from a VM's resource allocation crossing a physical NUMA node boundary.

  • Right-Size VMs: Keep vCPU count within physical cores of a single NUMA node.
  • Evenly Divide Resources: For monster/ wide VMs, ensure the total vCPUs are configured such that they are evenly divisible by the number of physical NUMA nodes they span.
    • Example: If a VM needs 16 vCPUs on a host with 12-core NUMA nodes, configure the vCPUs to be a multiple of a NUMA node count (e.g., 2 sockets $\times$ 8 cores per socket to create 2 vNUMA nodes, aligning with 2 pNUMA nodes).
  • Cores per Socket Setting (Important for older vSphere/Licensing): While vSphere 6.5 and later automatically present an optimal vNUMA topology, you should still configure the Cores per Socket setting on the VM to create a vNUMA structure that aligns with the physical NUMA boundaries of the host. This helps the guest OS make better scheduling decisions.
  • Disable VM CPU/ Memory Hot-Add: Plan capacity upfront.

NUMA awareness is critical for troubleshooting and optimizing VM performance on ESXi. Misconfigured NUMA placements can severely impact latency-sensitive workloads like databases and analytics. Regular checks at both the hypervisor and guest OS layers ensure memory locality, reduce latency, and improve efficiency.

References


Hope it was useful. Cheers!

Wednesday, June 26, 2024

vSphere with Tanzu using NSX-T - Part33 - Troubleshooting intermittent connection timeouts to apiserver and workloads

In the realm of managing Tanzu Kubernetes clusters (TKCs), we have encountered several challenges that hindered the smooth functioning of our applications. In this blog post, we will discuss three such cases and the workarounds we employed to resolve them.


Case 1: TKC Control Plane Node Connectivity Issues


Symptoms:
  • TKC apiserver connection timeouts when attempting to connect using the kubeconfig.
  • Traffic was not flowing to two of the control plane nodes.
  • NSX-T web UI LB VS stats indicated this issue.


Case 2: TKC Worker Node Connectivity Issues


Symptoms:
  • Workload (example: PostgreSQL cluster) connection timeouts.
  • Traffic was not flowing to two of the worker nodes in the TKC.
  • NSX-T web UI LB VS stats indicated this issue.


Case 3: Load Balancer Connectivity Issues


Symptoms:
  • Connection timeouts when attempting to connect to a PostgreSQL workload through the load balancer VS IP.
  • This issue was observed only when creating new services of type LoadBalancer in the TKC.
  • We noticed datapath mempool usage for the edge nodes was above the threshold value.


Resolution/ work around

  • Find the T1 router that is attached to the TKC which has connectivity issues. 
  • In an Active - Standby HA configuration, you will see that there will be one Edge node that will be Active and another one in Standby status. 
  • First place the Standby Edge node in NSX MM, reboot it, and then exit it from NSX MM. 
  • Now, place the Active Edge node in NSX MM, there will be a slight network disruption during this failover, once it is in NSX MM, reboot it, and then exit NSX MM. 
  • This should resolved the issue.


In conclusion, these cases illustrate the importance of verifying NSX-T components when managing Tanzu Kubernetes clusters. By identifying the root cause of the issues and employing effective workarounds, we were able to restore functionality and maintain the health of our applications. Stay tuned for more insights and best practices in managing Kubernetes clusters.

Hope it was useful. Cheers!

Saturday, June 22, 2024

vSphere with Tanzu using NSX-T - Part31 - Troubleshooting inaccessible TKC with expired control plane certs

In the course of managing multiple Tanzu Kubernetes Clusters (TKC), I encountered an unexpected issue: the control plane certificates had expired, preventing us from accessing the cluster using the kubeconfig file. To make matters worse, we were unable to SSH into the TKC control plane Virtual Machines (VMs) due to the vmware-system-user password expiring in accordance with STIG Hardening.

The recommended workaround for updating the vmware-system-user password expiry involves applying a specific daemonset on Guest Clusters. However, this approach requires access to the TKC using its admin kubeconfig file, which was unavailable due to the expired certificates.

Warning: In case of critical production issues that affect the accessibility of your Tanzu Kubernetes Cluster (TKC), it is strongly advised to submit a product support request to our team for assistance. This will ensure that you receive expert guidance and a timely resolution to help minimize the impact on your environment.

To resolve this issue, I followed an alternative workaround: I reset the root password of the TKC control plane VMs through the vCenter VM console, as outlined in this knowledge base article. Once the root password was reset, I was able to log directly into the TKC control plane VM using the VM console.


After gaining access to the TKC control plane VM, I proceeded to renew the control plane certificates using kubeadm, as detailed in this blog post. It's essential to apply this process to all control plane nodes in your cluster to ensure proper functionality.

root [ /etc/kubernetes ]# kubeadm certs check-expiration

root [ /etc/kubernetes ]# kubeadm certs renew all
[renew] Reading configuration from the cluster...
[renew] FYI: You can look at this config file with 'kubectl -n kube-system get cm kubeadm-config -o yaml'
[renew] Error reading configuration from the Cluster. Falling back to default configuration

certificate embedded in the kubeconfig file for the admin to use and for kubeadm itself renewed
certificate for serving the Kubernetes API renewed
certificate the apiserver uses to access etcd renewed
certificate for the API server to connect to kubelet renewed
certificate embedded in the kubeconfig file for the controller manager to use renewed
certificate for liveness probes to healthcheck etcd renewed
certificate for etcd nodes to communicate with each other renewed
certificate for serving etcd renewed
certificate for the front proxy client renewed
certificate embedded in the kubeconfig file for the scheduler manager to use renewed

Done renewing certificates. You must restart the kube-apiserver, kube-controller-manager, kube-scheduler and etcd, so that they can use the new certificates.

Although this workaround required some additional steps, it ultimately allowed us to regain access to our Tanzu Kubernetes Cluster and maintain its security and functionality.

Hope it was useful. Cheers!

Saturday, May 25, 2024

vSphere with Tanzu using NSX-T - Part30 - Troubleshooting inaccessible TKC with server pool members missing in the LB VS

Encountering issues with connectivity to your TKC apiserver/ control plane can be frustrating. One common problem we've seen is the kubeconfig failing to connect, often due to missing server pool members in the load balancer's virtual server (LB VS).

The Issue

The LB VS, which operates on port 6443, should have the control plane VMs listed as its member servers. When these members are missing, connectivity problems arise, disrupting your access to the TKC apiserver.

Troubleshooting steps

  1. Access the TKC: Use the kubeconfig to access the TKC.
    ❯ KUBECONFIG=tkc.kubeconfig kubectl get node
    Unable to connect to the server: dial tcp 10.191.88.4:6443: i/o timeout
    
    
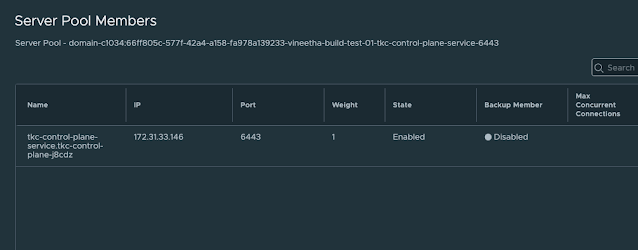
  2. Check the Load Balancer: In NSX-T, verify the status of the corresponding load balancer (LB). It may display a green status indicating success.
  3. Inspect Virtual Servers: Check the virtual servers in the LB, particularly on port 6443. They might show as down.
  4. Examine Server Pool Members: Look into the server pool members of the virtual server. You may find it empty.
  5. SSH to Control Plane Nodes: Attempt to SSH into the TKC control plane nodes.
  6. Run Diagnostic Commands: Execute diagnostic commands inside the control plane nodes to verify their status. The issue could be that the control plane VMs are in a hung state, and the container runtime is not running.
    vmware-system-user@tkc-infra-r68zc-jmq4j [ ~ ]$ sudo su
    root [ /home/vmware-system-user ]# crictl ps
    FATA[0002] failed to connect: failed to connect, make sure you are running as root and the runtime has been started: context deadline exceeded
    root [ /home/vmware-system-user ]#
    root [ /home/vmware-system-user ]# systemctl is-active containerd
    Failed to retrieve unit state: Failed to activate service 'org.freedesktop.systemd1': timed out (service_start_timeout=25000ms)
    root [ /home/vmware-system-user ]#
    root [ /home/vmware-system-user ]# systemctl status containerd
    WARNING: terminal is not fully functional
    -  (press RETURN)Failed to get properties: Failed to activate service 'org.freedesktop.systemd1'>
    lines 1-1/1 (END)lines 1-1/1 (END)
    
  7. Check VM Console: From vCenter, check the console of the control plane VMs. You might see specific errors indicating issues.
    EXT4-fs (sda3): Delayed block allocation failed for inode 266704 at logical offset 10515 with max blocks 2 with error 5
    EXT4-fs (sda3): This should not happen!! Data will be lost
    EXT4-fs error (device sda3) in ext4_writepages:2905: IO failure
    EXT4-fs error (device sda3) in ext4_reserve_inode_write:5947: Journal has aborted
    EXT4-fs error (device sda3) xxxxxx-xxx-xxxx: unable to read itable block
    EXT4-fs error (device sda3) in ext4_journal_check_start:61: Detected aborted journal
    systemd[1]: Caught <BUS>, dumped core as pid 24777.
    systemd[1]: Freezing execution.
    
  8. Restart Control Plane VMs: Restart the control plane VMs. Note that sometimes your admin credentials or administrator@vsphere.local credentials may not allow you to restart the TKC VMs. In such cases, decode the username and password from the relevant secret and use these credentials to connect to vCenter and restart the hung TKC VMs.
    ❯ kubectx wdc-01-vc17
    Switched to context "wdc-01-vc17".
    
    ❯ kg secret -A | grep wcp
    kube-system                                 wcp-authproxy-client-secret                                               kubernetes.io/tls                                  3      291d
    kube-system                                 wcp-authproxy-root-ca-secret                                              kubernetes.io/tls                                  3      291d
    kube-system                                 wcp-cluster-credentials                                                   Opaque                                             2      291d
    vmware-system-nsop                          wcp-nsop-sa-vc-auth                                                       Opaque                                             2      291d
    vmware-system-nsx                           wcp-cluster-credentials                                                   Opaque                                             2      291d
    vmware-system-vmop                          wcp-vmop-sa-vc-auth                                                       Opaque                                             2      291d
    
    ❯ kg secrets -n vmware-system-vmop wcp-vmop-sa-vc-auth
    NAME                  TYPE     DATA   AGE
    wcp-vmop-sa-vc-auth   Opaque   2      291d
    ❯ kg secrets -n vmware-system-vmop wcp-vmop-sa-vc-auth -oyaml
    apiVersion: v1
    data:
      password: aWAmbHUwPCpKe1Uxxxxxxxxxxxx=
      username: d2NwLXZtb3AtdXNlci1kb21haW4tYzEwMDYtMxxxxxxxxxxxxxxxxxxxxxxxxQHZzcGhlcmUubG9jYWw=
    kind: Secret
    metadata:
      creationTimestamp: "2022-10-24T08:32:26Z"
      name: wcp-vmop-sa-vc-auth
      namespace: vmware-system-vmop
      resourceVersion: "336557268"
      uid: dcbdac1b-18bb-438c-ba11-76ed4d6bef63
    type: Opaque
    
    
    ***Decrypt the username and password from the secret and use it to connect to the vCenter.
    ***Following is an example using PowerCLI:
    
    PS /Users/vineetha> get-vm gc-control-plane-f266h
    
    Name                 PowerState Num CPUs MemoryGB
    ----                 ---------- -------- --------
    gc-control-plane-f2… PoweredOn  2        4.000
    
    PS /Users/vineetha> get-vm gc-control-plane-f266h | Restart-VMGuest
    Restart-VMGuest: 08/04/2023 22:20:20	Restart-VMGuest		Operation "Restart VM guest" failed for VM "gc-control-plane-f266h" for the following reason: A general system error occurred: Invalid fault
    PS /Users/vineetha>
    PS /Users/vineetha> get-vm gc-control-plane-f266h | Restart-VM
    
    Confirm
    Are you sure you want to perform this action?
    Performing the operation "Restart-VM" on target "VM 'gc-control-plane-f266h'".
    [Y] Yes  [A] Yes to All  [N] No  [L] No to All  [S] Suspend  [?] Help (default is "Y"): Y
    
    Name                 PowerState Num CPUs MemoryGB
    ----                 ---------- -------- --------
    gc-control-plane-f2… PoweredOn  2        4.000
    
    PS /Users/vineetha>
    
  9. Verify System Pods and Connectivity: Once the control plane VMs are restarted, the system pods inside them will start, and the apiserver will become accessible using the kubeconfig. You should also see the previously missing server pool members reappear in the corresponding LB virtual server, and the virtual server on port 6443 will be up and show a success status.

Following these steps should help you resolve the connectivity issues with your TKC apiserver/control plane effectively.Ensuring that your load balancer's virtual server is correctly configured with the appropriate member servers is crucial for maintaining seamless access. This runbook aims to guide you through the process, helping you get your TKC apiserver back online swiftly.

Note: If required for critical production issues related to TKC accessibility I strongly recommend to raise a product support request.

Hope it was useful. Cheers!

Sunday, October 29, 2023

Kubernetes 101 - Part12 - Debug pod

When it comes to troubleshooting application connectivity and name resolution issues in Kubernetes, having the right tools at your disposal can make all the difference. One of the most common challenges is accessing essential utilities like ping, nslookup, dig, traceroute, and more. To simplify this process, we've created a container image that packs a range of these utilities, making it easy to quickly identify and resolve connectivity issues.


The Container Image: A Swiss Army Knife for Troubleshooting

This container image, designed specifically for Kubernetes troubleshooting, comes pre-installed with the following essential utilities:

  1. ping: A classic network diagnostic tool for testing connectivity.
  2. dig: A DNS lookup tool for resolving domain names to IP addresses.
  3. nslookup: A network troubleshooting tool for resolving hostnames to IP addresses.
  4. traceroute: A network diagnostic tool for tracing the path of packets across a network.
  5. curl: A command-line tool for transferring data to and from a web server using HTTP, HTTPS, SCP, SFTP, TFTP, and more.
  6. wget: A command-line tool for downloading files from the web.
  7. nc: A command-line tool for reading and writing data to a network socket.
  8. netstat: A command-line tool for displaying network connections, routing tables, and interface statistics.
  9. ifconfig: A command-line tool for configuring network interfaces.
  10. route: A command-line tool for displaying and modifying the IP routing table.
  11. host: A command-line tool for performing DNS lookups and resolving hostnames.
  12. arp: A command-line tool for displaying and modifying the ARP cache.
  13. iostat: A command-line tool for displaying disk I/O statistics.
  14. top: A command-line tool for displaying system resource usage.
  15. free: A command-line tool for displaying free memory and swap space.
  16. vmstat: A command-line tool for displaying virtual memory statistics.
  17. pmap: A command-line tool for displaying process memory maps.
  18. mpstat: A command-line tool for displaying multiprocessor statistics.
  19. python3: A programming language and interpreter.
  20. pip: A package installer for Python.


Run as a pod on Kubernetes

kubectl run debug --image=vineethac/debug -n default -- sleep infinity


Exec into the debug pod

kubectl exec -it debug -n default -- bash 
root@debug:/# ping 8.8.8.8 PING 8.8.8.8 (8.8.8.8) 56(84) bytes of data. 64 bytes from 8.8.8.8: icmp_seq=1 ttl=46 time=49.3 ms 64 bytes from 8.8.8.8: icmp_seq=2 ttl=45 time=57.4 ms 64 bytes from 8.8.8.8: icmp_seq=3 ttl=46 time=49.4 ms ^C --- 8.8.8.8 ping statistics --- 3 packets transmitted, 3 received, 0% packet loss, time 2003ms rtt min/avg/max/mdev = 49.334/52.030/57.404/3.799 ms root@debug:/#
root@debug:/# nslookup google.com Server: 10.96.0.10 Address: 10.96.0.10#53 Non-authoritative answer: Name: google.com Address: 142.250.72.206 Name: google.com Address: 2607:f8b0:4005:80c::200e root@debug:/# exit exit ❯


Reference

https://github.com/vineethac/Docker/tree/main/debug-image

By having these essential utilities at your fingertips, you'll be better equipped to quickly identify and resolve connectivity issues in your Kubernetes cluster, saving you time and reducing the complexity of troubleshooting.

Hope it was useful. Cheers!

Friday, June 9, 2023

vSphere with Tanzu using NSX-T - Part26 - Jumpbox kubectl plugin to SSH to TKC node

For troubleshooting TKC (Tanzu Kubernetes Cluster) you may need to ssh into the TKC nodes. For doing ssh, you will need to first create a jumpbox pod under the supervisor namespace and from there you can ssh to the TKC nodes.

Here is the manual procedure: https://docs.vmware.com/en/VMware-vSphere/7.0/vmware-vsphere-with-tanzu/GUID-587E2181-199A-422A-ABBC-0A9456A70074.html


Following kubectl plugin creats a jumpbox pod under a supervisor namespace. You can exec into this jumpbox pod to ssh into the TKC VMs.

kubectl-jumpbox

#!/bin/bash

Help()
{
   # Display Help
   echo "Description: This plugin creats a jumpbox pod under a supervisor namespace. You can exec into this jumpbox pod to ssh into the TKC VMs."
   echo "Usage: kubectl jumpbox SVNAMESPACE TKCNAME"
   echo "Example: k exec -it jumpbox-tkc1 -n svns1 -- /usr/bin/ssh vmware-system-user@VMIP"
}

# Get the options
while getopts ":h" option; do
   case $option in
      h) # display Help
         Help
         exit;;
     \?) # incorrect option
         echo "Error: Invalid option"
         exit;;
   esac
done

kubectl create -f - <<EOF
apiVersion: v1
kind: Pod
metadata:
  name: jumpbox-$2
  namespace: $1           #REPLACE
spec:
  containers:
  - image: "photon:3.0"
    name: jumpbox
    command: [ "/bin/bash", "-c", "--" ]
    args: [ "yum install -y openssh-server; mkdir /root/.ssh; cp /root/ssh/ssh-privatekey /root/.ssh/id_rsa; chmod 600 /root/.ssh/id_rsa; while true; do sleep 30; done;" ]
    volumeMounts:
      - mountPath: "/root/ssh"
        name: ssh-key
        readOnly: true
    resources:
      requests:
        memory: 2Gi
  
  volumes:
    - name: ssh-key
      secret:
        secretName: $2-ssh     #REPLACE YOUR-CLUSTER-NAME-ssh 

  
EOF

Usage

  • Place the plugin in the system executable path.
  • I placed it in $HOME/.krew/bin directory in my laptop.
  • Once you copied the plugin to the proper path, you can make it executable by: chmod 755 kubectl-jumpbox
  • After that you should be able to run the plugin as: kubectl jumpbox SUPERVISORNAMESPACE TKCNAME


Example

❯ kg tkc -n vineetha-dns1-test
NAME               CONTROL PLANE   WORKER   TKR NAME                           AGE    READY   TKR COMPATIBLE   UPDATES AVAILABLE
tkc                1               3        v1.21.6---vmware.1-tkg.1.b3d708a   213d   True    True             [1.22.9+vmware.1-tkg.1.cc71bc8]
tkc-using-cci-ui   1               1        v1.23.8---vmware.3-tkg.1           37d    True    True

❯ kg po -n vineetha-dns1-test
NAME         READY   STATUS    RESTARTS   AGE
nginx-test   1/1     Running   0          29d


❯ kubectl jumpbox vineetha-dns1-test tkc
pod/jumpbox-tkc created

❯ kg po -n vineetha-dns1-test
NAME          READY   STATUS    RESTARTS   AGE
jumpbox-tkc   0/1     Pending   0          8s
nginx-test    1/1     Running   0          29d

❯ kg po -n vineetha-dns1-test
NAME          READY   STATUS    RESTARTS   AGE
jumpbox-tkc   1/1     Running   0          21s
nginx-test    1/1     Running   0          29d

❯ k jumpbox -h
Description: This plugin creats a jumpbox pod under a supervisor namespace. You can exec into this jumpbox pod to ssh into the TKC VMs.
Usage: kubectl jumpbox SVNAMESPACE TKCNAME
Example: k exec -it jumpbox-tkc1 -n svns1 -- /usr/bin/ssh vmware-system-user@VMIP

❯ kg vm -n vineetha-dns1-test -o wide
NAME                                                              POWERSTATE   CLASS               IMAGE                                                       PRIMARY-IP      AGE
tkc-control-plane-8rwpk                                           poweredOn    best-effort-small   ob-18900476-photon-3-k8s-v1.21.6---vmware.1-tkg.1.b3d708a   172.29.0.7      133d
tkc-using-cci-ui-control-plane-z8fkt                              poweredOn    best-effort-small   ob-20953521-tkgs-ova-photon-3-v1.23.8---vmware.3-tkg.1      172.29.13.130   37d
tkc-using-cci-ui-tkg-cluster-nodepool-9nf6-n6nt5-b97c86fb45mvgj   poweredOn    best-effort-small   ob-20953521-tkgs-ova-photon-3-v1.23.8---vmware.3-tkg.1      172.29.13.131   37d
tkc-workers-zbrnv-6c98dd84f9-52gn6                                poweredOn    best-effort-small   ob-18900476-photon-3-k8s-v1.21.6---vmware.1-tkg.1.b3d708a   172.29.0.6      133d
tkc-workers-zbrnv-6c98dd84f9-d9mm7                                poweredOn    best-effort-small   ob-18900476-photon-3-k8s-v1.21.6---vmware.1-tkg.1.b3d708a   172.29.0.8      133d
tkc-workers-zbrnv-6c98dd84f9-kk2dg                                poweredOn    best-effort-small   ob-18900476-photon-3-k8s-v1.21.6---vmware.1-tkg.1.b3d708a   172.29.0.3      133d

❯ k exec -it jumpbox-tkc -n vineetha-dns1-test -- /usr/bin/ssh vmware-system-user@172.29.0.7
The authenticity of host '172.29.0.7 (172.29.0.7)' can't be established.
ECDSA key fingerprint is SHA256:B7ptmYm617lFzLErJm7G5IdT7y4SJYKhX/OenSgguv8.
Are you sure you want to continue connecting (yes/no)? yes
Warning: Permanently added '172.29.0.7' (ECDSA) to the list of known hosts.
Welcome to Photon 3.0 (\m) - Kernel \r (\l)
 13:06:06 up 133 days,  4:46,  0 users,  load average: 0.23, 0.33, 0.27

36 Security notice(s)
Run 'tdnf updateinfo info' to see the details.
vmware-system-user@tkc-control-plane-8rwpk [ ~ ]$ sudo su
root [ /home/vmware-system-user ]#


Hope it was useful. Cheers!