Showing posts with label PowerCLI. Show all posts

Friday, September 20, 2024

VMware PowerCLI 101 - part10 - Verify vSphere cluster state

To verify the most common selected status attributes of the cluster:

Get-Cluster | Get-VMHost | Select Name,@{N='HAState';E={$_.ExtensionData.Runtime.DasHostState.State}},ConnectionState,PowerState,@{N='OverallStatus';E={$_.ExtensionData.OverallStatus}},@{N='ConfigStatus';E={$_.ExtensionData.ConfigStatus}},@{N='InMaintenanceMode';E={$_.ExtensionData.Runtime.InMaintenanceMode}},@{N='RebootRequired';E={$_.ExtensionData.Summary.RebootRequired}},@{N='BootTime';E={$_.ExtensionData.Runtime.BootTime}} | ft

> Get-Cluster | Get-VMHost | Select Name,@{N='HAState';E={$_.ExtensionData.Runtime.DasHostState.State}},ConnectionState,PowerState,@{N='OverallStatus';E={$_.ExtensionData.OverallStatus}},@{N='ConfigStatus';E={$_.ExtensionData.ConfigStatus}},@{N='InMaintenanceMode';E={$_.ExtensionData.Runtime.InMaintenanceMode}},@{N='RebootRequired';E={$_.ExtensionData.Summary.RebootRequired}},@{N='BootTime';E={$_.ExtensionData.Runtime.BootTime}} | ft

Name      HAState           ConnectionState PowerState OverallStatus ConfigStatus InMaintenanceMode RebootRequired BootTime
----      -------           --------------- ---------- ------------- ------------ ----------------- -------------- --------
10.90.1.4 connectedToMaster       Connected  PoweredOn        yellow       yellow             False          False 8/27/2024 7:31:10 AM
10.90.1.5 master                  Connected  PoweredOn        yellow       yellow             False          False 9/6/2024 9:08:09 PM

Hope it was useful. Cheers!

Saturday, May 25, 2024

vSphere with Tanzu using NSX-T - Part30 - Troubleshooting inaccessible TKC with server pool members missing in the LB VS

Encountering issues with connectivity to your TKC apiserver/ control plane can be frustrating. One common problem we've seen is the kubeconfig failing to connect, often due to missing server pool members in the load balancer's virtual server (LB VS).

The Issue

The LB VS, which operates on port 6443, should have the control plane VMs listed as its member servers. When these members are missing, connectivity problems arise, disrupting your access to the TKC apiserver.

Troubleshooting steps

  1. Access the TKC: Use the kubeconfig to access the TKC.
    ❯ KUBECONFIG=tkc.kubeconfig kubectl get node
    Unable to connect to the server: dial tcp 10.191.88.4:6443: i/o timeout
    
    
  2. Check the Load Balancer: In NSX-T, verify the status of the corresponding load balancer (LB). It may display a green status indicating success.
  3. Inspect Virtual Servers: Check the virtual servers in the LB, particularly on port 6443. They might show as down.
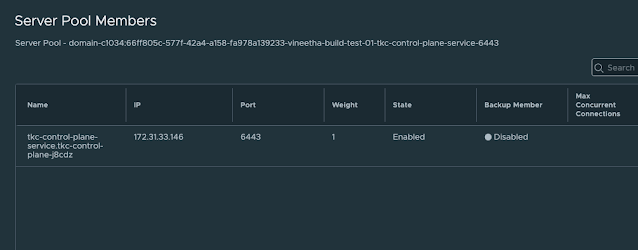
  4. Examine Server Pool Members: Look into the server pool members of the virtual server. You may find it empty.
  5. SSH to Control Plane Nodes: Attempt to SSH into the TKC control plane nodes.
  6. Run Diagnostic Commands: Execute diagnostic commands inside the control plane nodes to verify their status. The issue could be that the control plane VMs are in a hung state, and the container runtime is not running.
    vmware-system-user@tkc-infra-r68zc-jmq4j [ ~ ]$ sudo su
    root [ /home/vmware-system-user ]# crictl ps
    FATA[0002] failed to connect: failed to connect, make sure you are running as root and the runtime has been started: context deadline exceeded
    root [ /home/vmware-system-user ]#
    root [ /home/vmware-system-user ]# systemctl is-active containerd
    Failed to retrieve unit state: Failed to activate service 'org.freedesktop.systemd1': timed out (service_start_timeout=25000ms)
    root [ /home/vmware-system-user ]#
    root [ /home/vmware-system-user ]# systemctl status containerd
    WARNING: terminal is not fully functional
    -  (press RETURN)Failed to get properties: Failed to activate service 'org.freedesktop.systemd1'>
    lines 1-1/1 (END)lines 1-1/1 (END)
    
  7. Check VM Console: From vCenter, check the console of the control plane VMs. You might see specific errors indicating issues.
    EXT4-fs (sda3): Delayed block allocation failed for inode 266704 at logical offset 10515 with max blocks 2 with error 5
    EXT4-fs (sda3): This should not happen!! Data will be lost
    EXT4-fs error (device sda3) in ext4_writepages:2905: IO failure
    EXT4-fs error (device sda3) in ext4_reserve_inode_write:5947: Journal has aborted
    EXT4-fs error (device sda3) xxxxxx-xxx-xxxx: unable to read itable block
    EXT4-fs error (device sda3) in ext4_journal_check_start:61: Detected aborted journal
    systemd[1]: Caught <BUS>, dumped core as pid 24777.
    systemd[1]: Freezing execution.
    
  8. Restart Control Plane VMs: Restart the control plane VMs. Note that sometimes your admin credentials or administrator@vsphere.local credentials may not allow you to restart the TKC VMs. In such cases, decode the username and password from the relevant secret and use these credentials to connect to vCenter and restart the hung TKC VMs.
    ❯ kubectx wdc-01-vc17
    Switched to context "wdc-01-vc17".
    
    ❯ kg secret -A | grep wcp
    kube-system                                 wcp-authproxy-client-secret                                               kubernetes.io/tls                                  3      291d
    kube-system                                 wcp-authproxy-root-ca-secret                                              kubernetes.io/tls                                  3      291d
    kube-system                                 wcp-cluster-credentials                                                   Opaque                                             2      291d
    vmware-system-nsop                          wcp-nsop-sa-vc-auth                                                       Opaque                                             2      291d
    vmware-system-nsx                           wcp-cluster-credentials                                                   Opaque                                             2      291d
    vmware-system-vmop                          wcp-vmop-sa-vc-auth                                                       Opaque                                             2      291d
    
    ❯ kg secrets -n vmware-system-vmop wcp-vmop-sa-vc-auth
    NAME                  TYPE     DATA   AGE
    wcp-vmop-sa-vc-auth   Opaque   2      291d
    ❯ kg secrets -n vmware-system-vmop wcp-vmop-sa-vc-auth -oyaml
    apiVersion: v1
    data:
      password: aWAmbHUwPCpKe1Uxxxxxxxxxxxx=
      username: d2NwLXZtb3AtdXNlci1kb21haW4tYzEwMDYtMxxxxxxxxxxxxxxxxxxxxxxxxQHZzcGhlcmUubG9jYWw=
    kind: Secret
    metadata:
      creationTimestamp: "2022-10-24T08:32:26Z"
      name: wcp-vmop-sa-vc-auth
      namespace: vmware-system-vmop
      resourceVersion: "336557268"
      uid: dcbdac1b-18bb-438c-ba11-76ed4d6bef63
    type: Opaque
    
    
    ***Decrypt the username and password from the secret and use it to connect to the vCenter.
    ***Following is an example using PowerCLI:
    
    PS /Users/vineetha> get-vm gc-control-plane-f266h
    
    Name                 PowerState Num CPUs MemoryGB
    ----                 ---------- -------- --------
    gc-control-plane-f2… PoweredOn  2        4.000
    
    PS /Users/vineetha> get-vm gc-control-plane-f266h | Restart-VMGuest
    Restart-VMGuest: 08/04/2023 22:20:20	Restart-VMGuest		Operation "Restart VM guest" failed for VM "gc-control-plane-f266h" for the following reason: A general system error occurred: Invalid fault
    PS /Users/vineetha>
    PS /Users/vineetha> get-vm gc-control-plane-f266h | Restart-VM
    
    Confirm
    Are you sure you want to perform this action?
    Performing the operation "Restart-VM" on target "VM 'gc-control-plane-f266h'".
    [Y] Yes  [A] Yes to All  [N] No  [L] No to All  [S] Suspend  [?] Help (default is "Y"): Y
    
    Name                 PowerState Num CPUs MemoryGB
    ----                 ---------- -------- --------
    gc-control-plane-f2… PoweredOn  2        4.000
    
    PS /Users/vineetha>
    
  9. Verify System Pods and Connectivity: Once the control plane VMs are restarted, the system pods inside them will start, and the apiserver will become accessible using the kubeconfig. You should also see the previously missing server pool members reappear in the corresponding LB virtual server, and the virtual server on port 6443 will be up and show a success status.

Following these steps should help you resolve the connectivity issues with your TKC apiserver/control plane effectively.Ensuring that your load balancer's virtual server is correctly configured with the appropriate member servers is crucial for maintaining seamless access. This runbook aims to guide you through the process, helping you get your TKC apiserver back online swiftly.

Note: If required for critical production issues related to TKC accessibility I strongly recommend to raise a product support request.

Hope it was useful. Cheers!

Saturday, August 13, 2022

vSphere with Tanzu using NSX-T - Part18 - Troubleshooting vSphere pods with ProviderFailed status

In this article, we will take a look at fixing vSphere pods with ProviderFailed status. Following is an example:

svc-opa-gatekeeper-domain-c61                 gatekeeper-controller-manager-5ccbc7fd79-5gn2n                    0/1     ProviderFailed     0          2d14h
svc-opa-gatekeeper-domain-c61 gatekeeper-controller-manager-5ccbc7fd79-5jtvj 0/1 ProviderFailed 0 2d13h
svc-opa-gatekeeper-domain-c61 gatekeeper-controller-manager-5ccbc7fd79-5whtt 0/1 ProviderFailed 0 2d14h
svc-opa-gatekeeper-domain-c61 gatekeeper-controller-manager-5ccbc7fd79-6p2zv 0/1 ProviderFailed 0 2d13h
svc-opa-gatekeeper-domain-c61 gatekeeper-controller-manager-5ccbc7fd79-7r92p 0/1 ProviderFailed 0 2d14h
When describing the pod, you can see the message "Unable to find backing for logical switch".

❯ kd po gatekeeper-controller-manager-5ccbc7fd79-5gn2n -n svc-opa-gatekeeper-domain-c61
Name: gatekeeper-controller-manager-5ccbc7fd79-5gn2n
Namespace: svc-opa-gatekeeper-domain-c61
Priority: 2000000000
Priority Class Name: system-cluster-critical
Node: esx-1.sddc-35-82-xxxxx.xxxxxxx.com/
Labels: control-plane=controller-manager
gatekeeper.sh/operation=webhook
gatekeeper.sh/system=yes
pod-template-hash=5ccbc7fd79
Annotations: attachment_id: 668b681b-fef6-43e5-8009-5ac8deb6da11
kubernetes.io/psp: wcp-default-psp
mac: 04:50:56:00:08:1e
vlan: None
vmware-system-ephemeral-disk-uuid: 6000C297-d1ba-ce8c-97ba-683a3c8f5321
vmware-system-image-references: {"manager":"gatekeeper-111fd0f684141bdad12c811b4f954ae3d60a6c27-v52049"}
vmware-system-vm-moid: vm-89777:750f38c6-3b0e-41b7-a94f-4d4aef08e19b
vmware-system-vm-uuid: 500c9c37-7055-1708-92d4-8ffdf932c8f9
Status: Failed
Reason: ProviderFailed
Message: Unable to find backing for logical switch 03f0dcd4-a5d9-431e-ae9e-d796ddca0131: timed out waiting for the condition Unable to find backing for logical switch: 03f0dcd4-a5d9-431e-ae9e-d796ddca0131
IP:
IPs: <none>
A workaround for this is to restart the spherelet service on the ESXi host where you see this issue. If there are multiple ESXi nodes having same issue, you could consider restarting the spherelet service on all ESXi worker nodes. In a production setup you may want to consider placing the ESXi in maintenance mode before restarting the spherelet service. In my case, we usually restart the spherelet service directly without placing the ESXi in MM. Following is the PowerCLI way to check/ restart spherelet service on ESXi worker nodes:
 

> Connect-VIServer wdc-10-vc21

> Get-VMHost | Get-VMHostService | where {$_.Key -eq "spherelet"} | select VMHost,Key,Running | ft

VMHost Key Running
------ --- -------
wdc-10-r0xxxxxxxxxxxxxxxxxxxx spherelet True

> $sphereletservice = Get-VMHost wdc-10-r0xxxxxxxxxxxxxxxxxxxx | Get-VMHostService | where {$_.Key -eq "spherelet"}
> Stop-VMHostService -HostService $sphereletservice

Perform operation?
Perform operation Stop host service. on spherelet?
[Y] Yes [A] Yes to All [N] No [L] No to All [S] Suspend [?] Help (default is "Y"): Y

Key Label Policy Running Required
--- ----- ------ ------- --------
spherelet spherelet on False False

> Get-VMHost wdc-10-r0xxxxxxxxxxxxxxxxxxxx | Get-VMHostService | where {$_.Key -eq "spherelet"}

Key Label Policy Running Required
--- ----- ------ ------- --------
spherelet spherelet on False False

> Start-VMHostService -HostService $sphereletservice

Key Label Policy Running Required
--- ----- ------ ------- --------
spherelet spherelet on True False

To restart spherelet service on all ESXi worker nodes of a cluster:
> Get-Cluster

Name HAEnabled HAFailover DrsEnabled DrsAutomationLevel
Level
---- --------- ---------- ---------- ------------------
wdc-10-vcxxc01 True 1 True FullyAutomated

> Get-Cluster -Name wdc-10-vcxxc01 | Get-VMHost | foreach { Restart-VMHostService -HostService ($_ | Get-VMHostService | where {$_.Key -eq "spherelet"}) }

After restarting the spherelet service, new pods will come up fine and be in Running status. But you may need to clean up all those pods with ProviderFailed status using kubectl. 
kubectl get pods -A | grep ProviderFailed | awk '{print $2 " --namespace=" $1}' | xargs kubectl delete pod

Hope it was useful. Cheers!

Friday, December 10, 2021

ESXi in a HA cluster fails to Enter Maintenance Mode and gets stuck

Recently we came across a situation where when we try to put a ESXi host in Maintenance Mode, it is getting stuck at certain level. These ESXi nodes were part of a vSphere with Tanzu 7 U3 cluster. While troubleshooting we noticed that there are some VMs that are either orphaned or inaccessible running on it. We deleted those orphaned and inaccessible VMs and then the ESXi node enters Maintenance Mode successfully.

You can use VMware PowerCLI to list those orphaned and inaccessible VMs.

(Get-VMHost <host_fqdn> | Get-VM | Where {$_.ExtensionData.Summary.Runtime.ConnectionState -eq "orphaned"}) | select Name,Id,PowerState

(Get-VMHost <host_fqdn> | Get-VM | Where {$_.ExtensionData.Summary.Runtime.ConnectionState -eq "inaccessible"}) | select Name,Id,PowerState

We then deleted those orphaned and inaccessible VMs. You can try to delete them using Remove-VM command. 

Remove-VM -VM <vm_name> -DeletePermanently 

If that does not work, you can try with dcli.

dcli> com vmware vcenter vm delete --vm <vm-id>

Hope it was useful.

Wednesday, July 21, 2021

VMware PowerCLI 101 - part9 - Working with NSX-T

Note I am using the following versions:

PSVersion: 7.1.3
VMware PowerCLI: 
12.3.0.17860403

Connect-NsxtServer -Server 192.168.41.8


Get-Module "VMware.VimAutomation.Nsx*" -ListAvailable
Get-Command -Module "VMware.VimAutomation.Nsxt"


Get-NsxtService | measure
Get-NsxtService | more


Get-NsxtService com.vmware.nsx.cluster
$t1 = Get-NsxtService com.vmware.nsx.cluster
$t1 | Get-Member
$t1.get()


$t1 = Get-NsxtService com.vmware.nsx.cluster.status
$t1.get()
$t1.get().mgmt_cluster_status
$t1.get().control_cluster_status


$t1 = Get-NsxtService com.vmware.nsx.capacity.usage
$t1.get().capacity_usage | select usage_type, display_name, current_usage_count, max_supported_count, current_usage_percentage,severity | ft


$t1 = Get-NsxtService com.vmware.nsx.alarms
$t1.list().results | select feature_name, event_type, summary, severity, status | ft


Hope it was useful. Cheers!

References

Friday, October 23, 2020

VMware PowerCLI 101 - part8 - Working with vSAN

This article explains how to work with vSAN resources using PowerCLI. 

Note I am using the following versions:
PowerShell: 5.1.14393.3866
VMware PowerCLI: 12.1.0.17009493


Connect to vCenter:
Connect-VIServer <IP of vCenter server>

List all vSAN get cmdlets:
Get-Command Get-Vsan*


vSAN runtime info:
$c = Get-Cluster Cluster01
Get-VsanRuntimeInfo -Cluster $c


vSAN space usage:
Get-VsanSpaceUsage


vSAN cluster configuration:
Get-VsanClusterConfiguration


vSAN disk details:
Get-VsanDisk


View all properties of a disk:
(Get-VsanDisk)[31] | select *


View disk vendor, model, firmware revision, physical location, operational state:
(Get-VsanDisk)[31].ExtensionData


 vSAN disk group details:
Get-VsanDiskGroup


Get all properties of a disk group:

Friday, February 21, 2020

VMware PowerCLI 101 - part7 - Working with vROps

This article explains how to work with vROps resources using PowerCLI. The following diagram shows the relationship between adapters, resource kinds, and resources. There can be multiple adapters installed on the vROps instance. Each adapter kind will have multiple resource kinds and each resource kind will have multiple resources. And each resource will have its own badges and badge scores.


Note I am using the following versions:
PowerShell: 5.1.14393.3383
VMware PowerCLI: 11.3.0.13990089
vROps: 7.0

Connect to vROps:
Connect-OMServer <IP of vROps>

Get the list of all installed adapters:
Get-OMResource | select AdapterKind -Unique


Get all resource kinds of a specific adapter:
Get-OMResource -AdapterKind VMWARE | select ResourceKind -Unique


Get the list of resources of a specific resource kind:
Get-OMResource -ResourceKind Datacenter


Another example:
Get-OMResource -ResourceKind ClusterComputeResource


Get details of a specific resource:
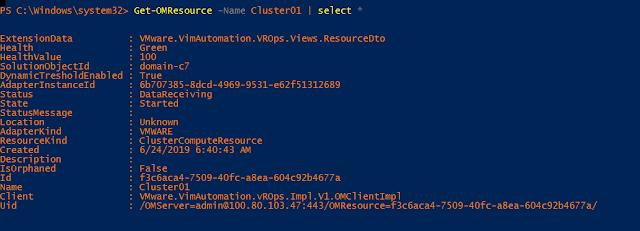
Get-OMResource -Name Cluster01 | select *


Get badge details of a selected resource:
(Get-OMResource -Name Cluster01).ExtensionData.Badges


List all resources of an adapter kind where health is not green:
Get-OMResource -AdapterKind VMWARE | select AdapterKind,ResourceKind,Name,Health,State,Status | where health -ne Green | ft


Get the list all objects of an adapter kind that have collection issues:
Get-OMResource -AdapterKind VMWARE | select AdapterKind,ResourceKind,Name,Health,State,Status | where {($_.Status -ne "DataReceiving") -or ($_.State -ne "Started")} | ft


Get the list of all active critical alerts from a specific adapter type:
Get-OMResource -AdapterKind VMWARE | Get-OMAlert -Criticality Critical -Status Active


Hope it was helpful. Cheers!

Related posts

VMware PowerCLI 101 Blog Series

Friday, December 20, 2019

VMware PowerCLI 101 - part6 - vSphere networking

Networking is one of the important factors for ensuring service availability. Incorrect network configurations will lead to the unavailability of data and services and if this happens in a production environment it will negatively affect the business. 

In this article, I will briefly explain how to use PowerCLI to work with basic vSphere networking.

Connect to vCenter server using:
Connect-VIServer <IP address of vCenter>


VM IP


To get all IP details of a VM:
(Get-VM -Name <VM name>).Guest.IPAddress


VM network adapters, MAC, and IP


To get all network adapters, MAC address and IP details of a VM:
(Get-VM -Name <VM name>).Guest.Nics | select *


OR

(Get-VM -Name <VM name>).ExtensionData.Guest.Net


VDS


To get all the Virtual Distributed Switches (VDS):
Get-VDSwitch


To get all the details of a specific VDS:
Get-VDSwitch -Name <VD Switch name> | select *


To get VDS security policy:
Get-VDSwitch -Name <VD Switch name> | Get-VDSecurityPolicy | select *


VD Port group


To get all port groups of a specific VDS:
Get-VDPortgroup -VDSwitch <VD Switch name>


To get all the details of a specific port group in a VDS:
Get-VDPortgroup -VDSwitch <VD Switch name> -Name <Port group name> | select *


VD Port


To get all VD ports of a specific VD port group in a VDS:
Get-VDSwitch <VD Switch name> | Get-VDPortgroup <Port group name> | Get-VDPort

To get only active VD ports of a specific VD port group in a VDS:
Get-VDSwitch <VD Switch name> | Get-VDPortgroup <Port group name> | Get-VDPort -ActiveOnly


To get all details of a specific VD port in a VDS:
Get-VDPort -Key <Value> -VDSwitch <VD Switch name> | select * 


VM connected to a VD port


To get the VM that is connected to a VD port:
(Get-VDPort -Key <Value> -VDSwitch <VD Switch name>).ExtensionData.Connectee
Get-VM -Id <VM Id>


Find VM using NIC MAC


Get-VM | where {$_.ExtensionData.Guest.Net.MacAddress -eq '<MAC Address>'}


Hope it was useful. Cheers!


Related posts


Monday, October 7, 2019

VMware PowerCLI 101 - Part5 - Real time storage IOPS and latency

It is very important to monitor and analyze the performance of storage subsystem components as it direcly affects the application performance. In this article, I will briefly explain how to use PowerCLI to get real time storage IOPS and latency of the following: 

              • Virtual disk
              • Datastore
              • Disk/ LUN 
              • Storage adapter
              • Storage path
Connect to vCenter server using:
Connect-VIServer <IP address of vCenter>

To understand the list of all available stats for a specific entity, you can use Get-StatType. For example, to list all real time stats for a virtual machine you can use:
Get-StatType -Entity <VM name> -Realtime | sort

Virtual disk

To get real-time IOPS and latency of all virtual disks of a VM named 'lustre01':
Get-Stat -Entity lustre01 -Realtime -MaxSamples 1 -Stat virtualDisk.numberReadAveraged.average,virtualDisk.numberWriteAveraged.average,virtualDisk.totalReadLatency.average,virtualDisk.totalWriteLatency.average | sort Instance,MetricId | select MetricId, Value, Unit, Instance


Datastore

To get real-time IOPS and latency of a datastore (with Uuid: 5bea72bb-5d72ed6a-1d85-246e96792988) from an ESXi host (IP: 192.168.105.10):
Get-Stat -Entity 192.168.105.10 -Stat datastore.numberReadAveraged.average,datastore.numberWriteAveraged.average,datastore.totalReadLatency.average,datastore.totalWriteLatency.average -Realtime -MaxSamples 1 -Instance 5bea72bb-5d72ed6a-1d85-246e96792988 | Select MetricId, Value, Unit, Instance | Sort-Object MetricId

Note: You can get Uuid of a datastore using (Get-Datastore vol01).ExtensionData.Info.Vmfs.Uuid


Refer my article "Real time VMware datastore performance monitoring using PowerShell" for monitoring the real time performance statistics of multiple shared VMFS datastores which are part of a multi-node VMware ESXi cluster.

Disk/ LUN

To get real-time IOPS and latency of a disk (eui.387de1af35b93f6ff0a9bef000000000): 
Get-Stat -Entity 192.168.105.10 -Disk -Realtime -Instance eui.387de1af35b93f6ff0a9bef000000000 -MaxSamples 1 -Stat disk.numberWriteAveraged.average,disk.numberReadAveraged.average,disk.totalWriteLatency.average,disk.totalReadLatency.average | Select MetricId, Value, Unit, Instance


Storage adapter

To get real-time IOPS and latency of a storage adapter: 
Get-Stat -Entity 192.168.105.10 -Realtime -MaxSamples 1 -Stat storageAdapter.totalReadLatency.average, storageAdapter.totalWriteLatency.average, storageAdapter.numberReadAveraged.average, storageAdapter.numberWriteAveraged.average -Instance vmhba64 | Select-Object MetricId, Value, Unit, Instance | Sort-Object MetricId


Storage Path

To get real-time IOPS and latency of a storage path:
Get-Stat -Entity 192.168.105.10 -Realtime -MaxSamples 1 -Stat storagePath.totalReadLatency.average, storagePath.totalWriteLatency.average, storagePath.numberReadAveraged.average, storagePath.numberWriteAveraged.average -Instance fc.300fb123ba76519c:b436362bae5b217-fc.300fb123ba76519c:b436362bae5b217-eui.387de1af35b93f6ff0a9beec00000001 | Select MetricId,Value,Unit,Instance | Sort-Object MetricId