In this article we will look at a TKC that is stuck at updating phase which has multiple Kubernetes nodes in NotReady state.
jtimothy-napp01 gc updating 2021-07-29T16:59:34Z v1.20.9+vmware.1-tkg.1.a4cee5b 3 3
❯ gcc kg no | grep NotReady | wc -l
5
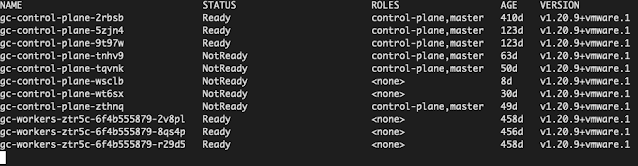
❯ gcc kg no
NAME STATUS ROLES AGE VERSION
gc-control-plane-2rbsb Ready control-plane,master 410d v1.20.9+vmware.1
gc-control-plane-5zjn4 Ready control-plane,master 123d v1.20.9+vmware.1
gc-control-plane-9t97w Ready control-plane,master 123d v1.20.9+vmware.1
gc-control-plane-tnhv9 NotReady control-plane,master 63d v1.20.9+vmware.1
gc-control-plane-tqvnk NotReady control-plane,master 50d v1.20.9+vmware.1
gc-control-plane-wsclb NotReady <none> 8d v1.20.9+vmware.1
gc-control-plane-wt6sx NotReady <none> 30d v1.20.9+vmware.1
gc-control-plane-zthnq NotReady control-plane,master 49d v1.20.9+vmware.1
gc-workers-ztr5c-6f4b555879-2v8pl Ready <none> 458d v1.20.9+vmware.1
gc-workers-ztr5c-6f4b555879-8qs4p Ready <none> 456d v1.20.9+vmware.1
gc-workers-ztr5c-6f4b555879-r29d5 Ready <none> 458d v1.20.9+vmware.1
❯ gcc kg po -A -o wide | grep etcd
kube-system etcd-gc-control-plane-2rbsb 0/1 Running 811 410d 172.31.14.6 gc-control-plane-2rbsb <none> <none>
kube-system etcd-gc-control-plane-5zjn4 1/1 Running 1 124d 172.31.14.7 gc-control-plane-5zjn4 <none> <none>
kube-system etcd-gc-control-plane-9t97w 1/1 Running 1 123d 172.31.14.8 gc-control-plane-9t97w <none> <none>
Note: gcc is alias that I am using for KUBECONFIG=gckubeconfig, where gckubeconfig is the kubeconfig file for the TKC under consideration.
Lets verify where etcd pods are running.
❯ gcc kg po -A -o wide | grep etcd
kube-system                    etcd-gc-control-plane-2rbsb                         0/1     Running            811        410d    172.31.14.6       gc-control-plane-2rbsb              <none>           <none>
kube-system                    etcd-gc-control-plane-5zjn4                         1/1     Running            1          124d    172.31.14.7       gc-control-plane-5zjn4              <none>           <none>
kube-system                    etcd-gc-control-plane-9t97w                         1/1     Running            1          123d    172.31.14.8       gc-control-plane-9t97w              <none>           <none>
You can see etcd pods are running on nodes that are in Ready status. So now we can go ahead and safely drain and delete the nodes that are NotReady.
❯ notreadynodes=$(gcc kubectl get nodes | grep NotReady | awk '{print $1;}')

❯ echo $notreadynodes
gc-control-plane-tnhv9
gc-control-plane-tqvnk
gc-control-plane-wsclb
gc-control-plane-wt6sx
gc-control-plane-zthnq

❯ echo "$notreadynodes" | while IFS= read -r line ; do echo $line; gcc kubectl drain $line --ignore-daemonsets; gcc kubectl delete node $line; echo "----"; done

gc-control-plane-tnhv9
node/gc-control-plane-tnhv9 already cordoned
WARNING: ignoring DaemonSet-managed Pods: kube-system/calico-node-nzbgq, kube-system/kube-proxy-2jqqr, vmware-system-csi/vsphere-csi-node-46g6r
node/gc-control-plane-tnhv9 drained
node "gc-control-plane-tnhv9" deleted
----
gc-control-plane-tqvnk
node/gc-control-plane-tqvnk already cordoned
WARNING: ignoring DaemonSet-managed Pods: kube-system/calico-node-45xfc, kube-system/kube-proxy-dxrkr, vmware-system-csi/vsphere-csi-node-wrvlk
node/gc-control-plane-tqvnk drained
node "gc-control-plane-tqvnk" deleted
----
gc-control-plane-wsclb
node/gc-control-plane-wsclb already cordoned
WARNING: ignoring DaemonSet-managed Pods: kube-system/calico-node-5t254, kube-system/kube-proxy-jt2dp, vmware-system-csi/vsphere-csi-node-w2bhf
node/gc-control-plane-wsclb drained
node "gc-control-plane-wsclb" deleted
----
gc-control-plane-wt6sx
node/gc-control-plane-wt6sx already cordoned
WARNING: ignoring DaemonSet-managed Pods: kube-system/calico-node-24pn5, kube-system/kube-proxy-b5vl5, vmware-system-csi/vsphere-csi-node-hfjdw
node/gc-control-plane-wt6sx drained
node "gc-control-plane-wt6sx" deleted
----
gc-control-plane-zthnq
node/gc-control-plane-zthnq already cordoned
WARNING: ignoring DaemonSet-managed Pods: kube-system/calico-node-vp895, kube-system/kube-proxy-8mg8n, vmware-system-csi/vsphere-csi-node-hs22g
node/gc-control-plane-zthnq drained
node "gc-control-plane-zthnq" deleted
----

❯ gcc kg no
NAME                                STATUS   ROLES                  AGE    VERSION
gc-control-plane-2rbsb              Ready    control-plane,master   410d   v1.20.9+vmware.1
gc-control-plane-5zjn4              Ready    control-plane,master   123d   v1.20.9+vmware.1
gc-control-plane-9t97w              Ready    control-plane,master   123d   v1.20.9+vmware.1
gc-workers-ztr5c-6f4b555879-2v8pl   Ready    <none>                 458d   v1.20.9+vmware.1
gc-workers-ztr5c-6f4b555879-8qs4p   Ready    <none>                 456d   v1.20.9+vmware.1
gc-workers-ztr5c-6f4b555879-r29d5   Ready    <none>                 458d   v1.20.9+vmware.1
❯
❯ kgtkca | grep jtimothy-napp01
jtimothy-napp01    gc       updating       2021-07-29T16:59:34Z   v1.20.9+vmware.1-tkg.1.a4cee5b     3     3
Now, I waited for few minutes to see whether the reconciliation process will proceed and change the status of the TKC from updating to running. But it was still stuck at updating phase. So I described the TKC.
Conditions:
    Last Transition Time:  2022-12-30T19:47:15Z
    Message:               Rolling 1 replicas with outdated spec (2 replicas up to date)
    Reason:                RollingUpdateInProgress
    Severity:              Warning
    Status:                False
    Type:                  Ready
    Last Transition Time:  2023-01-01T19:19:45Z
    Status:                True
    Type:                  AddonsReady
    Last Transition Time:  2022-12-30T19:47:15Z
    Message:               Rolling 1 replicas with outdated spec (2 replicas up to date)
    Reason:                RollingUpdateInProgress
    Severity:              Warning
    Status:                False
    Type:                  ControlPlaneReady
    Last Transition Time:  2022-07-24T15:53:06Z
    Status:                True
    Type:                  NodePoolsReady
    Last Transition Time:  2022-09-01T09:02:26Z
    Message:               3/3 Control Plane Node(s) healthy. 3/3 Worker Node(s) healthy
    Status:                True
    Type:                  NodesHealthy
Checked vmop logs.
vmware-system-vmop/vmware-system-vmop-controller-manager-85d8986b94-xzd9h[manager]: E0103 08:43:51.449422 1 readiness_worker.go:111] readiness-probe "msg"="readiness probe fails" "error"="dial tcp 172.31.14.6:6443: connect: connection refused" "vmName"="jtimothy-napp01/gc-control-plane-2rbsb" "result"=-1
It says something is wrong with CP node gc-control-plane-2rbsb.
❯ gcc kg po -A -o wide | grep etcd
kube-system                    etcd-gc-control-plane-2rbsb                         0/1     Running            811        410d    172.31.14.6       gc-control-plane-2rbsb              <none>           <none>
kube-system                    etcd-gc-control-plane-5zjn4                         1/1     Running            1          124d    172.31.14.7       gc-control-plane-5zjn4              <none>           <none>
kube-system                    etcd-gc-control-plane-9t97w                         1/1     Running            1          123d    172.31.14.8       gc-control-plane-9t97w              <none>           <none>
You can see etcd pod is not running on first control plane node and is getting continuously restarted. So lets try to drain the CP node gc-control-plane-2rbsb.
❯ gcc k drain gc-control-plane-2rbsb
node/gc-control-plane-2rbsb cordoned
DEPRECATED WARNING: Aborting the drain command in a list of nodes will be deprecated in v1.23.
The new behavior will make the drain command go through all nodes even if one or more nodes failed during the drain.
For now, users can try such experience via: --ignore-errors
error: unable to drain node "gc-control-plane-2rbsb", aborting command...

There are pending nodes to be drained:
 gc-control-plane-2rbsb
cannot delete DaemonSet-managed Pods (use --ignore-daemonsets to ignore): kube-system/calico-node-bdjp7, kube-system/kube-proxy-v9cqf, vmware-system-auth/guest-cluster-auth-svc-n4h2k, vmware-system-csi/vsphere-csi-node-djhpv
cannot delete Pods with local storage (use --delete-emptydir-data to override): vmware-system-csi/vsphere-csi-controller-b4fd6878d-zw5hn

❯ gcc k drain gc-control-plane-2rbsb --ignore-daemonsets --delete-emptydir-data
node/gc-control-plane-2rbsb already cordoned
WARNING: ignoring DaemonSet-managed Pods: kube-system/calico-node-bdjp7, kube-system/kube-proxy-v9cqf, vmware-system-auth/guest-cluster-auth-svc-n4h2k, vmware-system-csi/vsphere-csi-node-djhpv
evicting pod vmware-system-csi/vsphere-csi-controller-b4fd6878d-zw5hn
pod/vsphere-csi-controller-b4fd6878d-zw5hn evicted
node/gc-control-plane-2rbsb evicted

❯ gcc kg no
NAME                                STATUS                     ROLES                  AGE    VERSION
gc-control-plane-2rbsb              Ready,SchedulingDisabled   control-plane,master   410d   v1.20.9+vmware.1
gc-control-plane-5zjn4              Ready                      control-plane,master   123d   v1.20.9+vmware.1
gc-control-plane-9t97w              Ready                      control-plane,master   123d   v1.20.9+vmware.1
gc-workers-ztr5c-6f4b555879-2v8pl   Ready                      <none>                 458d   v1.20.9+vmware.1
gc-workers-ztr5c-6f4b555879-8qs4p   Ready                      <none>                 456d   v1.20.9+vmware.1
gc-workers-ztr5c-6f4b555879-r29d5   Ready                      <none>                 458d   v1.20.9+vmware.1
Now lets delete its corresponding machine object.
❯ k delete machine.cluster.x-k8s.io/gc-control-plane-2rbsb -n jtimothy-napp01
machine.cluster.x-k8s.io "gc-control-plane-2rbsb" deleted
❯
❯ kg machine -n jtimothy-napp01
NAME                                CLUSTER   NODENAME                            PROVIDERID                                       PHASE     AGE    VERSION
gc-control-plane-5zjn4              gc        gc-control-plane-5zjn4              vsphere://42015c9c-feed-5eda-6fbe-f0da5d1434ea   Running   124d   v1.20.9+vmware.1
gc-control-plane-9t97w              gc        gc-control-plane-9t97w              vsphere://4201377e-0f46-40b6-e222-9c723c6adb19   Running   123d   v1.20.9+vmware.1
gc-workers-ztr5c-6f4b555879-2v8pl   gc        gc-workers-ztr5c-6f4b555879-2v8pl   vsphere://420139b4-83f1-824f-7bd2-ed073a5dcf37   Running   458d   v1.20.9+vmware.1
gc-workers-ztr5c-6f4b555879-8qs4p   gc        gc-workers-ztr5c-6f4b555879-8qs4p   vsphere://4201d8ac-9cc2-07ac-c352-9f7e812b4367   Running   456d   v1.20.9+vmware.1
gc-workers-ztr5c-6f4b555879-r29d5   gc        gc-workers-ztr5c-6f4b555879-r29d5   vsphere://42017666-8cb4-2767-5d0b-1d3dc9219db3   Running   458d   v1.20.9+vmware.1
❯
❯ gcc kg no
NAME                                STATUS   ROLES                  AGE    VERSION
gc-control-plane-5zjn4              Ready    control-plane,master   124d   v1.20.9+vmware.1
gc-control-plane-9t97w              Ready    control-plane,master   123d   v1.20.9+vmware.1
gc-workers-ztr5c-6f4b555879-2v8pl   Ready    <none>                 458d   v1.20.9+vmware.1
gc-workers-ztr5c-6f4b555879-8qs4p   Ready    <none>                 456d   v1.20.9+vmware.1
gc-workers-ztr5c-6f4b555879-r29d5   Ready    <none>                 458d   v1.20.9+vmware.1
❯
After few minutes you can see a new machine and the corresponding node got provisioned and the TKC changed from updating to running phase.
❯ kg machine -n jtimothy-napp01
NAME                                CLUSTER   NODENAME                            PROVIDERID                                       PHASE          AGE    VERSION
gc-control-plane-5zjn4              gc        gc-control-plane-5zjn4              vsphere://42015c9c-feed-5eda-6fbe-f0da5d1434ea   Running        124d   v1.20.9+vmware.1
gc-control-plane-9t97w              gc        gc-control-plane-9t97w              vsphere://4201377e-0f46-40b6-e222-9c723c6adb19   Running        123d   v1.20.9+vmware.1
gc-control-plane-dnr66              gc                                                                                             Provisioning   13s    v1.20.9+vmware.1
gc-workers-ztr5c-6f4b555879-2v8pl   gc        gc-workers-ztr5c-6f4b555879-2v8pl   vsphere://420139b4-83f1-824f-7bd2-ed073a5dcf37   Running        458d   v1.20.9+vmware.1
gc-workers-ztr5c-6f4b555879-8qs4p   gc        gc-workers-ztr5c-6f4b555879-8qs4p   vsphere://4201d8ac-9cc2-07ac-c352-9f7e812b4367   Running        456d   v1.20.9+vmware.1
gc-workers-ztr5c-6f4b555879-r29d5   gc        gc-workers-ztr5c-6f4b555879-r29d5   vsphere://42017666-8cb4-2767-5d0b-1d3dc9219db3   Running        458d   v1.20.9+vmware.1


❯ kg machine -n jtimothy-napp01
NAME                                CLUSTER   NODENAME                            PROVIDERID                                       PHASE     AGE    VERSION
gc-control-plane-5zjn4              gc        gc-control-plane-5zjn4              vsphere://42015c9c-feed-5eda-6fbe-f0da5d1434ea   Running   124d   v1.20.9+vmware.1
gc-control-plane-9t97w              gc        gc-control-plane-9t97w              vsphere://4201377e-0f46-40b6-e222-9c723c6adb19   Running   124d   v1.20.9+vmware.1
gc-control-plane-dnr66              gc        gc-control-plane-dnr66              vsphere://42011228-b156-3338-752a-e7233c9258dd   Running   2m2s   v1.20.9+vmware.1
gc-workers-ztr5c-6f4b555879-2v8pl   gc        gc-workers-ztr5c-6f4b555879-2v8pl   vsphere://420139b4-83f1-824f-7bd2-ed073a5dcf37   Running   458d   v1.20.9+vmware.1
gc-workers-ztr5c-6f4b555879-8qs4p   gc        gc-workers-ztr5c-6f4b555879-8qs4p   vsphere://4201d8ac-9cc2-07ac-c352-9f7e812b4367   Running   456d   v1.20.9+vmware.1
gc-workers-ztr5c-6f4b555879-r29d5   gc        gc-workers-ztr5c-6f4b555879-r29d5   vsphere://42017666-8cb4-2767-5d0b-1d3dc9219db3   Running   458d   v1.20.9+vmware.1
❯
❯ gcc kg no
NAME                                STATUS     ROLES                  AGE    VERSION
gc-control-plane-5zjn4              Ready      control-plane,master   124d   v1.20.9+vmware.1
gc-control-plane-9t97w              Ready      control-plane,master   123d   v1.20.9+vmware.1
gc-control-plane-dnr66              NotReady   control-plane,master   35s    v1.20.9+vmware.1
gc-workers-ztr5c-6f4b555879-2v8pl   Ready      <none>                 458d   v1.20.9+vmware.1
gc-workers-ztr5c-6f4b555879-8qs4p   Ready      <none>                 456d   v1.20.9+vmware.1
gc-workers-ztr5c-6f4b555879-r29d5   Ready      <none>                 458d   v1.20.9+vmware.1


❯ gcc kg no
NAME                                STATUS   ROLES                  AGE    VERSION
gc-control-plane-5zjn4              Ready    control-plane,master   124d   v1.20.9+vmware.1
gc-control-plane-9t97w              Ready    control-plane,master   123d   v1.20.9+vmware.1
gc-control-plane-dnr66              Ready    control-plane,master   53s    v1.20.9+vmware.1
gc-workers-ztr5c-6f4b555879-2v8pl   Ready    <none>                 458d   v1.20.9+vmware.1
gc-workers-ztr5c-6f4b555879-8qs4p   Ready    <none>                 456d   v1.20.9+vmware.1
gc-workers-ztr5c-6f4b555879-r29d5   Ready    <none>                 458d   v1.20.9+vmware.1

❯ kgtkca | grep jtimothy-napp01
jtimothy-napp01     gc     running      2021-07-29T16:59:34Z   v1.20.9+vmware.1-tkg.1.a4cee5b     3     3
Hope it was useful. Cheers!


