This blog series captures practical learnings from working with GPUs in real‑world environments, with a focus on operations, reliability, and scale. Each post deep‑dives into specific aspects of GPU systems based on hands‑on experience, incidents, and operational challenges. Together, these articles aim to share actionable insights, highlight common pitfalls, and help teams build more robust and predictable GPU operations.
A blog on the evolving infrastructure stack - virtualization, Kubernetes, and GPUs.
Saturday, March 7, 2026
Sunday, May 7, 2023
Kubernetes 101 - Part9 - kubeconfig certificate expiration
You can verify the expiration date of kubeconfig in the current context as follows:
kubectl config view --minify --raw --output 'jsonpath={..user.client-certificate-data}' | base64 -d | openssl x509 -noout -enddate
❯ k config current-context
sc2-01-vcxx
❯
❯ kubectl config view --minify --raw --output 'jsonpath={..user.client-certificate-data}' | base64 -d | openssl x509 -noout -enddate
notAfter=Sep  6 05:13:47 2023 GMT
❯
❯ date
Thu Sep  7 18:05:52 IST 2023
❯
Hope it was useful. Cheers!
Tuesday, December 15, 2020
Dell EMC PowerFlex MP for vROps 8.x - Part6 - Create custom alerts
In this post, we will take a look at creating custom alerts for PowerFlex by adding symptom definitions and alert definitions. Refer to my previous blog post to understand more about the alerting aspects in vROps. Here we will take an example scenario and see how we can create custom symptom definitions and alert definitions.
Scenario
Step1: Add Symptom Definitions
- Select the metric User Data SDC Read Latency (ms): double click on it twice so that you can define both warning and critical symptoms.
- Select the metric User Data SDC Write Latency (ms): double click on it twice so that you can define both warning and critical symptoms.
Step2: Add Alert Definitions
- Provide alert name, select the base object type and advanced settings and click Next.
- Filter and search the symptoms that we created earlier. Drag and drop the two volume read latency related symptoms and select Any. Click Next.
- If you want to provide any recommendations you can add it in this step and click Next.
- Select vSphere Solution's Default Policy and click Next and click Create.
Now, we are all done. Let's test the alerts! I am using FIO to generate IO load on one of the PowerFlex volume.
Related posts
Part1: Install
Part2: Configure
Part3: Dashboards
Part4: Resource kinds and relationships
Part5: Collection interval
References
Friday, December 4, 2020
Dell EMC PowerFlex MP for vROps 8.x - Part5 - Collection interval
In this post, we will take a look at modifying the collection interval of PowerFlex Adapter instances. The PowerFlex Management Pack for vROps supports 4 instance types.
- PowerFlex Gateway
- PowerFlex Networking
- PowerFlex Manager
- PowerFlex Nodes
Note: In the product guide it is recommended to configure not more than 40 Cisco switches in one PowerFlex Networking instance. So, if you have 80 switches in your PowerFlex system, you will need to configure 2 PowerFlex Networking instances where each instance will connect/ query/ collect details from 40 switches. This is based on the default collection interval of 5 minutes.
This simply means, in 5 minutes one PowerFlex Networking adapter instance can complete the collection from a max of 40 switches only. So, in 1 minute, it can complete the collection of a maximum of 8 switches. This is a rough calculation and it depends on factors like REST API response, switch firmware/ OS version, etc. So if you change the default interval, always make sure to monitor it (the collection cycle) for some time and verify whether the collection process is able to complete successfully within the new time interval.
Hope it was useful. Cheers!
Related posts
Part1 - Install
Part2 - Configure
Part3 - Dashboards
Part4 - Resource kinds and relationships
References
Product guide: https://infohub.delltechnologies.com/section-assets/powerflexadapter-for-vrops-product-guide
PowerFlex website: https://www.delltechnologies.com/PowerFlex
PowerFlex white papers and blog: https://infohub.delltechnologies.com/t/powerflex-14/
Friday, February 21, 2020
VMware PowerCLI 101 - part7 - Working with vROps
Note I am using the following versions:
PowerShell: 5.1.14393.3383
VMware PowerCLI: 11.3.0.13990089
vROps: 7.0
Connect to vROps:
Connect-OMServer <IP of vROps>
Get the list of all installed adapters:
Get-OMResource | select AdapterKind -Unique
Get all resource kinds of a specific adapter:
Get-OMResource -AdapterKind VMWARE | select ResourceKind -Unique
Get the list of resources of a specific resource kind:
Get-OMResource -ResourceKind Datacenter
Another example:
Get-OMResource -ResourceKind ClusterComputeResource
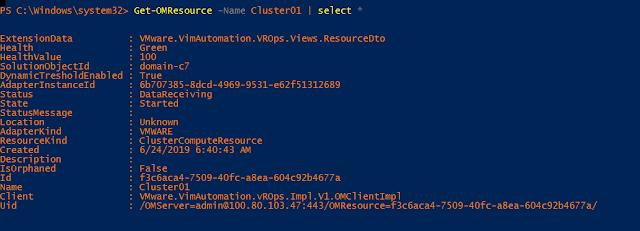
Get details of a specific resource:
Get-OMResource -Name Cluster01 | select *
Get badge details of a selected resource:
(Get-OMResource -Name Cluster01).ExtensionData.Badges
List all resources of an adapter kind where health is not green:
Get-OMResource -AdapterKind VMWARE | select AdapterKind,ResourceKind,Name,Health,State,Status | where health -ne Green | ft
Get-OMResource -AdapterKind VMWARE | select AdapterKind,ResourceKind,Name,Health,State,Status | where {($_.Status -ne "DataReceiving") -or ($_.State -ne "Started")} | ft
Get the list of all active critical alerts from a specific adapter type:
Get-OMResource -AdapterKind VMWARE | Get-OMAlert -Criticality Critical -Status Active
Hope it was helpful. Cheers!
Related posts


