Laying the Groundwork
My professional career commenced in February 2014, as a Trainee IT Services Engineer at Alamy Images. During my initial days, I was tasked with daily maintenance activities such as running tape backups, setting up Active Directory user accounts, mailboxes, and desktops for new employees. I also handled general IT support, troubleshooting various user issues within the organization.

After a few months, I had the opportunity to set up a lab infrastructure project using old decommissioned servers as part of a continuous learning initiative. This hands-on experience involved racking, stacking, and cabling physical servers, installing and configuring ESXi and Hyper-V hypervisors, FreeNAS storage servers, and deploying highly available clusters. Additionally, I gained exposure to configuring L2 network switches. This project significantly contributed to building my IT infrastructure foundation.
A year later, I was promoted to Junior IT Services Engineer, where I focused on virtualization projects. I spearheaded the migration of over 20 Dev/ Test/ UAT virtual machines from VMware to a Hyper-V cluster, enhancing system flexibility and cost-efficiency. I deployed a high-availability Hyper-V failover cluster in production and contributed to the planning and execution of a iSCSI storage server migration project.
Beyond virtualization, I worked on network infrastructure by a seamless L2 switch replacement and upgrade project with minimal operational disruption. Furthermore, I assisted in capacity planning initiatives for optimized resource utilization for both physical and virtual environments. These experiences refined my technical skills and problem-solving abilities. During this time, I developed a passion for infrastructure management and optimization, shaping my future career path.
From Junior IT Services Engineer to Storage Solutions Engineer
In January 2017, I transitioned to a Systems Development Engineer role at Dell EMC, specializing in Solutions Engineering. This marked a significant career shift as I immersed myself in the world of storage and virtualization solutions integration/development.
My daily responsibilities encompassed the installation and testing of various components, progressing from integration to validating system reliability and performance at scale. I designed and deployed multiple PowerFlex software-defined storage clusters for customer demos and proof-of-concepts, showcasing the product's performance and auto rebuild capabilities. A notable achievement was automating the storage performance benchmarking using PowerShell, FIO, and ELK stack, reducing process time from weeks to days.
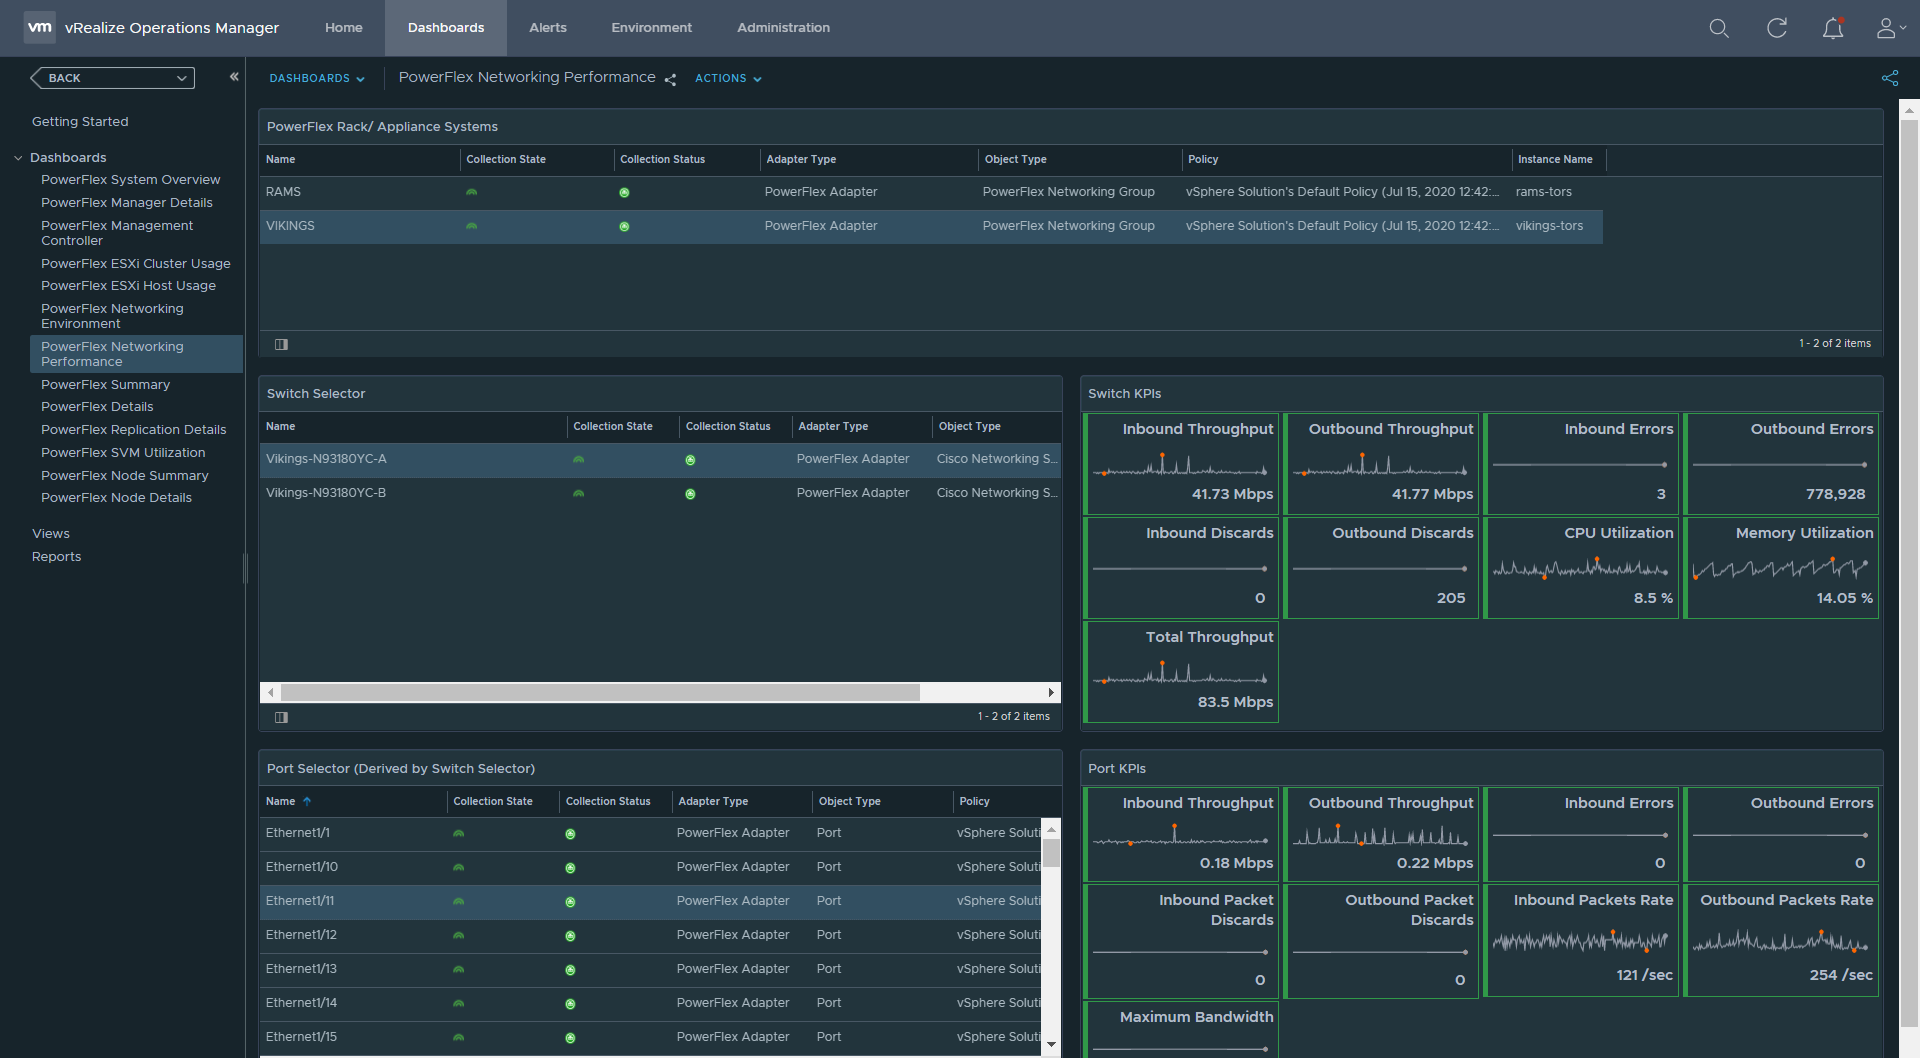
I led the engineering efforts for developing a vROps management pack for PowerFlex, ensuring seamless integration and visibility. Additionally, I mastered vSphere Virtual Volumes (vVols), successfully executing integration projects between Dell storage solutions and VMware environments.
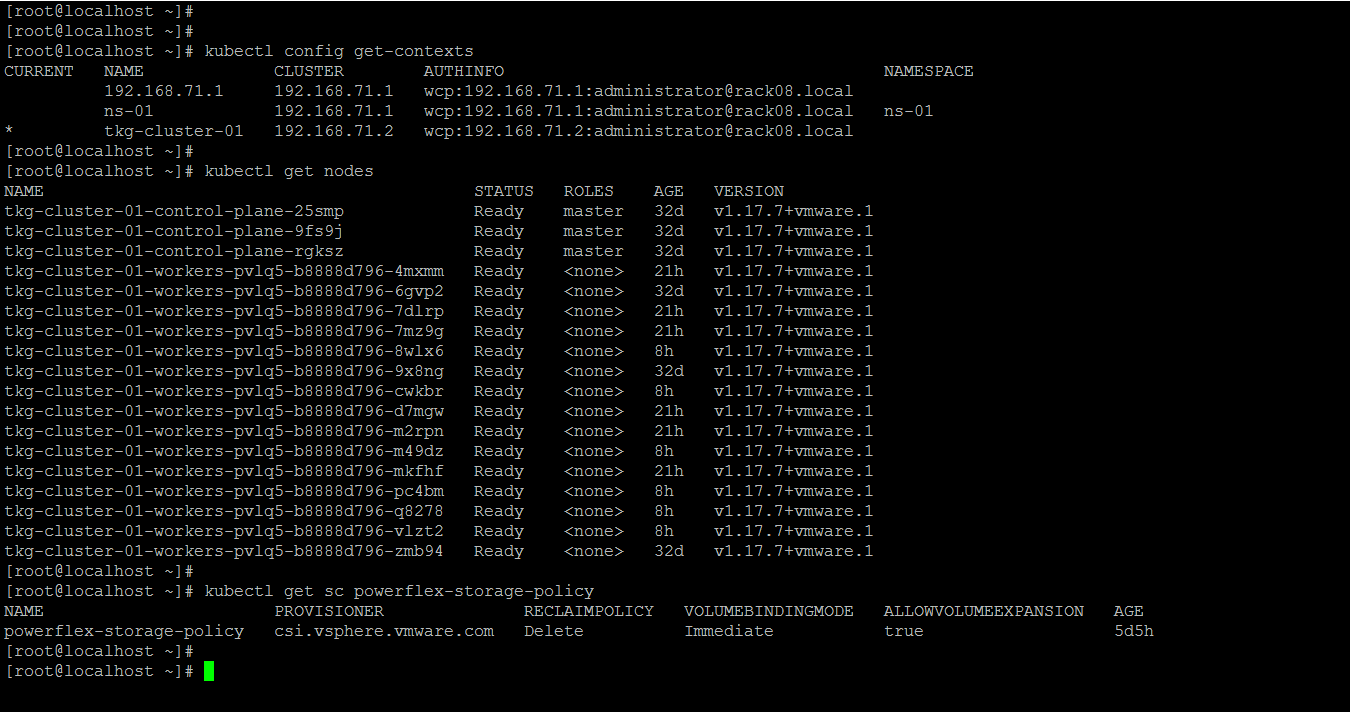
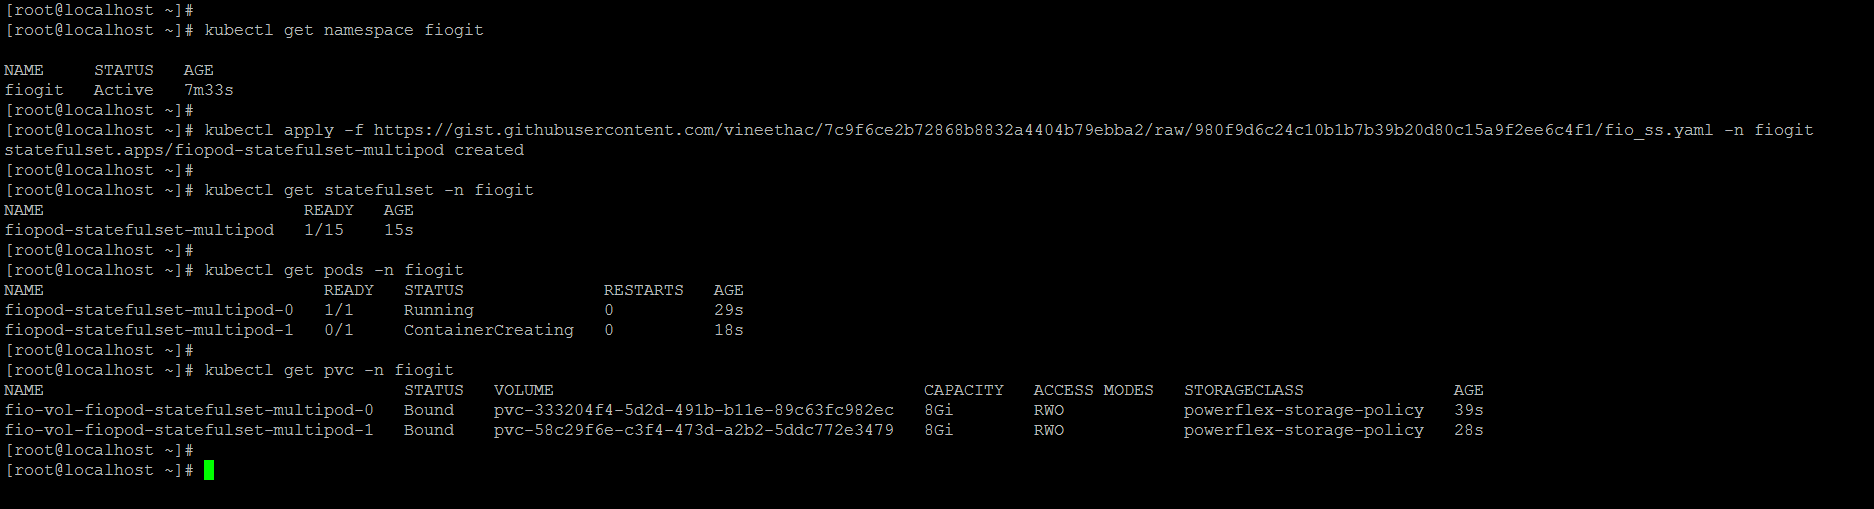
To streamline operations, I created a PowerShell module for managing PowerFlex using REST APIs and developed Ansible playbook for automated deployment of Kubernetes cluster with PowerFlex CSI driver. My expertise extended beyond systems engineering and automation as I authored and published whitepapers on disaster recovery using VMware SRM and hardware lifecycle management with Dell OME.
This period solidified my reputation as a virtualization and storage solutions expert, providing me with a deep understanding of storage architecture, performance optimization, and automation. I developed a passion for building scalable and reliable hyperconverged solutions.
From Storage Solutions Engineer to Site Reliability Engineer
In July 2021, I transitioned to a Site Reliability Engineer (SRE) role at VMware, focusing on ensuring the reliability and scalability of Kubernetes-as-a-Service project based on the vSphere with Tanzu platform.

Managing a vast infrastructure of Kubernetes clusters, I honed my skills in incident response, GitOps pipelines, automation, and monitoring. I played a crucial role in maintaining platform availability, collaborating closely with multiple internal teams and stakeholders to resolve issues and enhance service delivery. My proficiency in Python and PowerShell was instrumental in automating tasks and building custom monitoring solutions. During this time, I prepared diligently, practiced extensively, and successfully qualified for the CKA exam.
Beyond core SRE responsibilities, I explored emerging technologies. I successfully deployed and evaluated open-source language models on Kubernetes using Python, Ollama, and LangChain. In addition, I contributed to developing custom metrics for the Kubernetes-as-a-Service platform using Python, Prometheus, Grafana, and Helm.
This role deepened my expertise and ability to bridge the gap between development and operations, fostering a culture of reliability and efficiency. It has been an exciting journey of learning and growth, positioning me as a versatile IT professional with a strong foundation in both infrastructure and cloud-native technologies.
Gratitude
"This journey has been immensely fulfilling, made possible by the support and encouragement of exceptional organisations, inspiring managers, talented colleagues, friends, and family. I am truly grateful for the opportunities to learn, grow, and contribute meaningfully to driving success and making a positive impact."
The journey continues...