Showing posts with label vrealize. Show all posts

Friday, January 1, 2021

Dell EMC PowerFlex MP for vROps 8.x - Part7 - Create custom reports

In March 2020, I published a blog on how to create custom views and reports in vROps 8.x. This article explains how to create a custom storage report for Dell EMC PowerFlex using the PowerFlex Management Pack for vROps 8.x. 

Sample PowerFlex Storage Report PDF and template is available in my GitHub repo for download. You can use it as a starting point/ modify it as per requirement.

To create a new view: Dashboards - Views - Add.

Provide a name and description for the new view. Here, for example, I will create a view that shows PowerFlex Protection Domain Info.


Select List.


Select Protection Domain as subject and group it by PowerFlex Rack/ Appliance System.


Double click or drag and drop the selected metrics or properties to include in the view. In the following screenshot, I selected 4 capacity metrics to include in the view.


You can also select and change the units and transformation as per requirements. Once it is done, click Save.

Now a view is created. Similarly, you can create multiple views for the different PowerFlex resource kinds. The next step is to include this view in an existing template or in a new template. 

To create a new report template: Dashboards - Reports - Add.

  • Provide a name and description for the new report template.
  • From the views and dashboards, find the PowerFlex Protection Domain Info view that we created earlier, double-click or drag and drop them to the right pane. You can add multiple views to be included in this report template.
  • Select PDF and CSV.
  • Select all the layout options if you like to and click Save.
  • Now the custom report template is created. You can select it and click Run.

Select PowerFlex and then select PowerFlex World and click ok.


The report will run in the background and will be available to download under the "Generated Reports" tab. You can select it and download the PDF or CSV file. You can even configure a schedule to generate a report and email it or save it to a location automatically based on your requirements. Hope it was useful. Cheers!

Related posts


Sunday, November 8, 2020

Dell EMC PowerFlex MP for vROps 8.x - Part4 - Resource kinds and relationships

In this post, we will take a look at the different resource kinds that are part of the Dell EMC PowerFlex Management Pack. Following is a very high-level logical representation of the PowerFlex Adapter resource kinds and their relationships:


Go to Environment - All objects - PowerFlex Adapter


You can also get a PowerFlex system level view in vROps using the PowerFlex rack/ appliance system resource kind. This system view is making use of the system name field that we provided while configuring each PowerFlex Adapter instance type. The system name is used to group all the logical components of one PowerFlex system. 


This view provides end-to-end visibility of the PowerFlex infrastructure components that will be useful to understand the relationship between different layers of the stack. This will be also helpful to identify and troubleshoot in case of issues.

Hope it was useful. Cheers!

Related posts


Part1 - Install
Part2 - Configure
Part3 - Dashboards


Wednesday, November 4, 2020

Dell EMC PowerFlex MP for vROps 8.x - Part3 - Dashboards

We have covered the installation and configuration of the PowerFlex Management Pack in the previous posts. In this post, we will have a look at the different dashboards that are part of the MP. Following are the 13 dashboards you will get after installing the MP:

Overview
  • PowerFlex System Overview
PowerFlex Manager
  • PowerFlex Manager Details
Management Controller 
  • PowerFlex Management Controller
Compute
  • PowerFlex ESXi Cluster Usage
  • PowerFlex ESXi Host Usage
  • PowerFlex SVM Utilization
Networking
  • PowerFlex Networking Environment
  • PowerFlex Networking Performance
Storage
  • PowerFlex Summary
  • PowerFlex Details
  • PowerFlex Replication Details
Server Hardware
  • PowerFlex Node Summary
  • PowerFlex Node Details

Now, let's have a quick look at some of these dashboards and their functionality.

PowerFlex Node Summary


This dashboard shows the health of all PowerFlex nodes being monitored by the MP. You can see the classification of nodes as Compute Only, Storage Only, Hyperconverged, and Management Controller along with a relationship between a node and its corresponding hardware components.


PowerFlex Summary


This dashboard shows the health status of all the logical components of the PowerFlex storage system. It also has a parent-child relationship between different objects of the storage system. You can also see widgets for capacity usage trend forecasting, alerts, top storage pools by capacity usage, top volumes by size, etc.


PowerFlex Details


This dashboard shows all PowerFlex storage performance KPIs like IOPS, Bandwidth, Latency, etc.


PowerFlex Networking Environment


You can see the health status of Cisco networking components and the relationship between network interfaces, nodes, switch ports, VLANs, port-channels, etc.


PowerFlex Networking Performance


This dashboard shows the switch and switch port KPIs like Throughout, Errors, Packet discards, etc.


PowerFlex Manager


You can see the service deployment details like service health, RCM compliance status, deployment status, etc. in this dashboard.


Hope it was useful. Cheers!

References


Monday, November 2, 2020

Dell EMC PowerFlex MP for vROps 8.x - Part2 - Configure

In this post, I will explain how to configure the PowerFlex Management Pack for vROps


Before getting into the configuration, I would like to provide a high-level view of my lab setup. I have two separate PowerFlex rack systems that I will be monitoring using the management pack. The two systems are named RAMS and VIKINGS and have the following components.


The PowerFlex Management Pack supports the following 4 instance types:
  • PowerFlex Networking - queries and collects networking details from Cisco switches
  • PowerFlex Gateway - queries and collects storage details from PowerFlex Gateway
  • PowerFlex Nodes - queries and collects server hardware health details from iDRACs
  • PowerFlex Manager - queries and collects service deployment details from PowerFlex Manager

Note: The default collection interval for all PowerFlex Adapter instance types is set to 5 minutes.

I have already configured the controller VCSA and customer VCSA of both (RAMS and VIKINGS) clusters as shown below. This makes use of the native vSphere Adapter and vSAN Adapter present in vROps.


Note: The PowerFlex MP is already installed in vROps. Please see the previous post on how to install it.

Now we can start adding required accounts for the PowerFlex Adapter to connect to the different REST endpoints.

PowerFlex Networking


Click add account.


Select the PowerFlex Adapter.


Let's configure the account for monitoring Cisco TOR switches of the RAMS cluster.

Provide the following details:

  • Name
  • Management IP address of Cisco TOR switches

Select the instance type as "PowerFlex Networking" and provide a system name. 
In this case, these TOR switches are part of RAMS. So I have given the system name as RAMS.


Add a new credential. Select the credential kind as "PowerFlex Networking Adapter Credentials". 
Provide a credential name, username and password. Click OK.


Click VALIDATE CONNECTION.


If everything is fine, you will get a test connection successful message. Click OK.


Click ADD to save the account. You will see the account we just created under the other accounts page.
Initially, the status will be warning but it will turn to OK in few seconds.


Note: In the product guide it is recommended to configure not more than 40 Cisco switches in one PowerFlex Networking instance. So, if you have 80 switches in your PowerFlex system, you will need to configure 2 PowerFlex Networking instances where each instance will connect/ query/ collect details from 40 switches.

PowerFlex Gateway


PowerFlex Nodes


Make sure to provide the PowerFlex Management Controller vCenter details in the advanced settings. If you have configured the native adapter with vCenter IP address, then you have to provide the IP address in the advanced settings. In this case, I have configured the native adapter with the vCenter hostname/ FQDN, so in the advanced settings, I have provided the same FQDN. This field will be used to identify and classify the PowerFlex Management Controller nodes.

Note: In the product guide it is recommended to configure 30 iDRACs or less in one PowerFlex Node instance. So, if you have 120 nodes in your PowerFlex system, you will need to configure 4 PowerFlex Node instances where each instance will connect/ query/ collect details from 30 iDRACs.

PowerFlex Manager


Note: While adding the credentials for the PowerFlex Manager, it is mandatory to provide the PowerFlex Manager Domain Name. VXFMLOCAL is the domain name for the default admin user.

Verify the status of all accounts.


Now we have finished creating all the required accounts to monitor the RAMS system. Similarly, you can add multiple PowerFlex systems and monitor them using the management pack. In my case, I have one more PowerFlex system named VIKINGS and I have added all the required accounts as given in the following screenshot. As you can see below, for the VIKINGS system I have configured seperate instances for CO, SO, and Controller nodes. This is because the iDRAC credentials for CO, SO, and Controller nodes are different. 


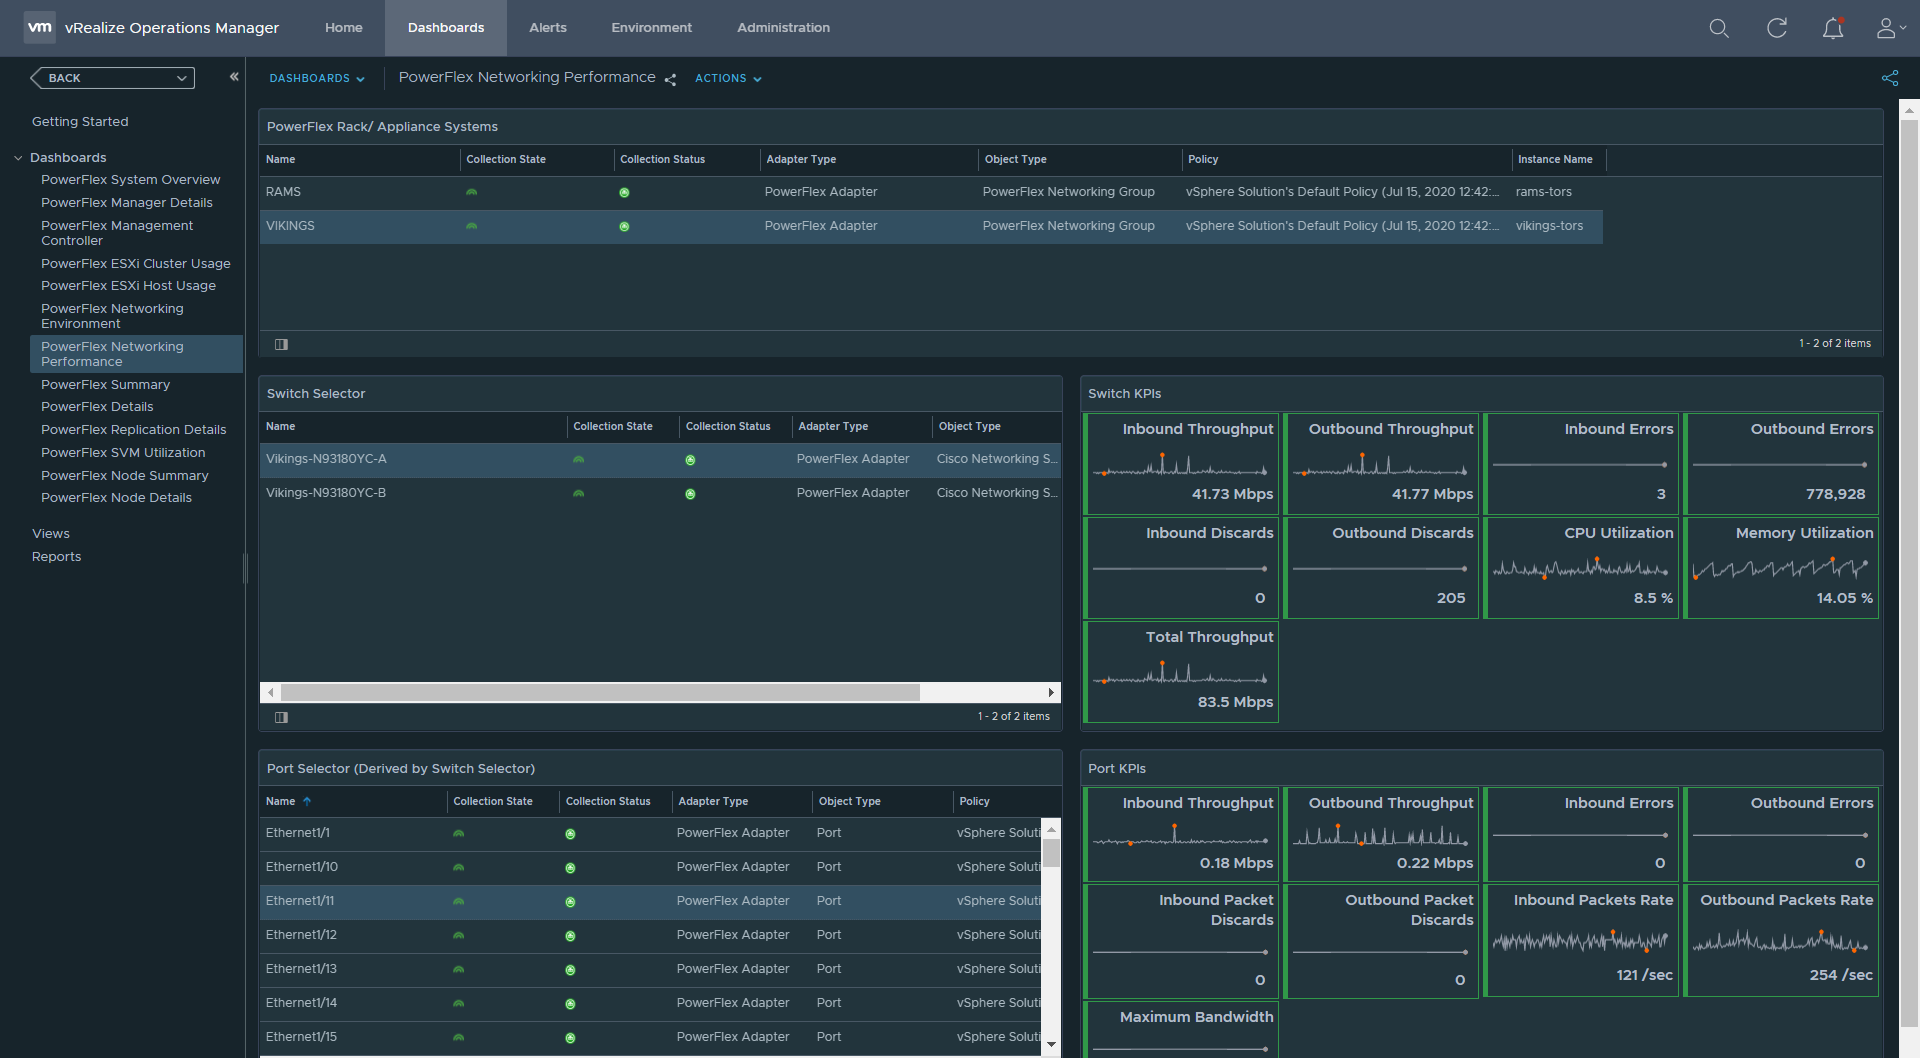
In the dashboards section, you can see all the 13 dashboards. Depending on the number of components/ size of the PowerFlex system, it may take 15-20 minutes for the data to get populated in the respective dashboards. 


In the next part, we will go through the different dashboards and other capabilities of the management pack. Hope it was useful. Cheers!

References

Friday, October 30, 2020

Dell EMC PowerFlex MP for vROps 8.x - Part1 - Install

Dell EMC has recently released a vROps management pack for PowerFlex. It is a monitoring and alerting solution that provides extensive visibility into PowerFlex systems using vROps. The management pack collects key metrics for PowerFlex storage, networking, compute, and server hardware and ingests into vROps. The solution is available to all PowerFlex rack and appliance customers free of cost. This brings additional value to the IT operations and life cycle management functionality delivered by PowerFlex Manager.

Now, let's start with installation of the management pack. The steps are same for vROps 8.0, 8.1, and 8.2.

Administration - Solutions - Repository - Add/ Upgrade

Browse and select the PAK file and click upload.


Click next.


Accept the EULA and click next.


Click finish.


The management pack is now installed and it will be listed in the repository.


Verify the contents of the management pack by selecting view content.


Verify the 13 dashboards.
Note: If any of the dashboards are missing, then try to reinstall the management pack.


In the next part, we will go through the adapter instance configurations. Hope it was useful. Cheers!

Related posts


Part2 - Configure
Part3 - Dashboards
Part4 - Resource kinds and relationships


References


Sunday, February 16, 2020

How to manually add multiple NICs to the vROps 8.x appliance

Important note: This is officially NOT supported by vROps. I've had a specific one off use case in my lab. It is just a quick workaround and is not recommended in production environment as this solution is not supported by VMware.
 
This article explains how to add multiple network interfaces to a vROps 8.0 and 8.1 appliance. Recently we had a scenario where the vROps appliance needs access to different networks that are isolated/ not routed with the primary network management interface of vROps. In my case, the vROps instance needed access to 3 different networks.

Initially while installing the vROps there will be only one interface (10-eth0.network) and its the default interface for vROps appliance. 


For configuring additional interfaces follow the steps below:

  • Add a network card and connect to the respective port group by editing VM settings
  • Login to vROps with root creds
  • cd /etc/systemd/network/
  • Create an entry for the new interface 10-eth1.network (as it will not be present!)
  • vi 10-eth1.network
  • Provide all necessary IP details and save

  • Restart network service systemctl restart systemd-networkd
  • Verify /opt/vmware/share/vami/vami_config_net

  • Similarly, follow the above steps if you require more interfaces 

Note: This solutions is NOT officially supported by vROps. It is not recommended in production environment.

Related post 

References

Friday, December 27, 2019

vRealize Operations Manager 7.5 - Part10 - Adding Remote Collector Node

In this article, I will briefly explain the configuration of a remote collector node and a sample scenario too.

Note: Before adding the remote collector nodes a vROps master node should be present.

Refer to my previous blogs for the installation and configuration of the vROps master node and enabling high availability. Here I have a single node vROps 7.5 instance which is a master and I will be expanding it with a remote collector node.

Consider the following scenario:

Datacenter A is the head office where the vROps master is installed. Datacenter B and C need to be monitored using the vROps instance configured at Datacenter A. In this case, Remote Collector nodes are installed at Datacenter B and C. As per VMware recommendation the latency between sites should be 200ms or less. 


Refer vROps 7.5 reference architecture for recommendations from VMware on different deployment profiles and other best practices. 

Deploy a vROps instance at the remote location and open its management IP address in a web browser. 

Click on Expand an existing installation.

Click Next.


Provide a name for the collector node and select node type Remote Collector.
Enter IP of vROps master node and click Validate.


Click Next.


Provide cluster admin password and click Next.


Click Finish.


This may take around 6-8 minutes to complete.


Select Finish adding new nodes.


Click OK.


The remote collector is now part of the cluster.


Now log in to the master vROps instance.
Select Administration > Management > Collector Groups.
You can see only the master node is part of the Default collector group.
Click Create collector Group (+).


Provide a name and select the remote collector node.


Now you can see the remote collector node is part of the newly created collector group.


Now, we will add a vCenter Adapter instance that will monitor the vCenter server of the remote site using the newly added remote collector node.
Click Administration > Solutions > Configuration > VMware vSphere.
Click Configure (gear icon).


Click (+) to add a new vCenter adapter and provide the necessary details.


In the advanced settings, select the collector group.


Click Test connection, Accept and save settings. 


Click OK.


Verify the collection state and status.


Hope it was useful. Cheers.

Related posts