Overview


Hope it was useful. Cheers!
- PowerFlex System Overview
PowerFlex Manager
- PowerFlex Manager Details
Management Controller
- PowerFlex Management Controller
Compute
- PowerFlex ESXi Cluster Usage
- PowerFlex ESXi Host Usage
- PowerFlex SVM Utilization
Networking
- PowerFlex Networking Environment
- PowerFlex Networking Performance
Storage
- PowerFlex Summary
- PowerFlex Details
- PowerFlex Replication Details
Server Hardware
- PowerFlex Node Summary
- PowerFlex Node Details
Now, let's have a quick look at some of these dashboards and their functionality.
PowerFlex Node Summary
This dashboard shows the health of all PowerFlex nodes being monitored by the MP. You can see the classification of nodes as Compute Only, Storage Only, Hyperconverged, and Management Controller along with a relationship between a node and its corresponding hardware components.

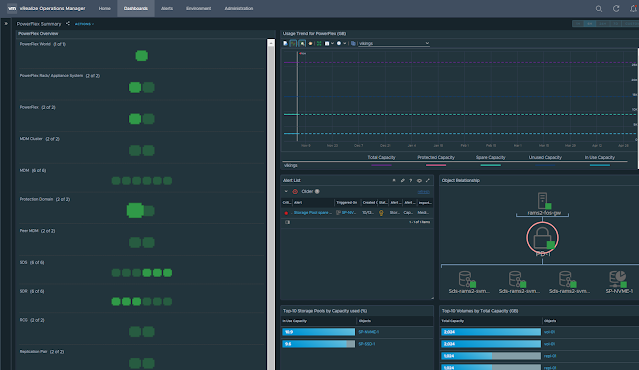
PowerFlex Summary
This dashboard shows the health status of all the logical components of the PowerFlex storage system. It also has a parent-child relationship between different objects of the storage system. You can also see widgets for capacity usage trend forecasting, alerts, top storage pools by capacity usage, top volumes by size, etc.

PowerFlex Details
This dashboard shows all PowerFlex storage performance KPIs like IOPS, Bandwidth, Latency, etc.

PowerFlex Networking Environment
You can see the health status of Cisco networking components and the relationship between network interfaces, nodes, switch ports, VLANs, port-channels, etc.

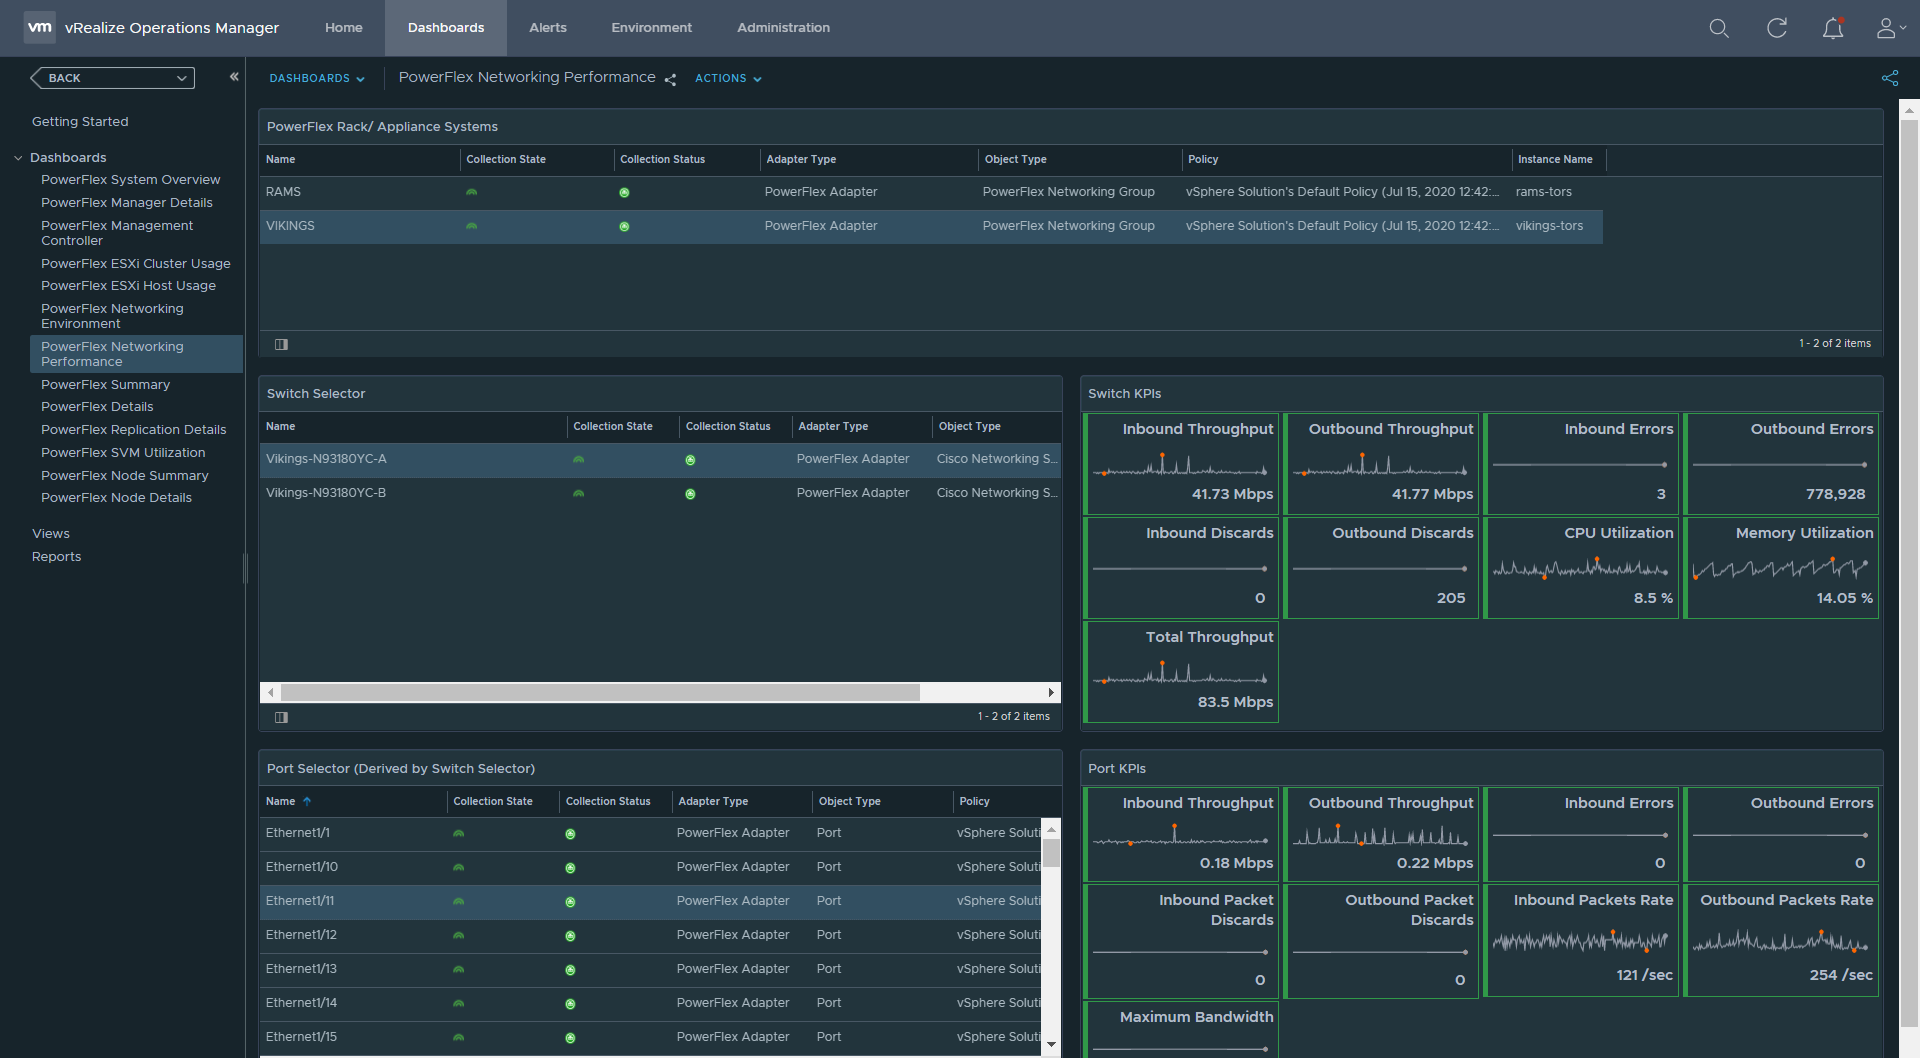
PowerFlex Networking Performance
This dashboard shows the switch and switch port KPIs like Throughout, Errors, Packet discards, etc.
PowerFlex Manager
You can see the service deployment details like service health, RCM compliance status, deployment status, etc. in this dashboard.

Hope it was useful. Cheers!
References
Product guide: https://infohub.delltechnologies.com/section-assets/powerflexadapter-for-vrops-product-guide
PowerFlex website: https://www.delltechnologies.com/PowerFlex
PowerFlex white papers and blog: https://infohub.delltechnologies.com/t/powerflex-14/
No comments:
Post a Comment
Note: Only a member of this blog may post a comment.