In the previous posts we discussed the following:
In this article, I will explain some of the popular tools used for monitoring Kubernetes clusters that provides insight into different objects in K8s, status, metrics, logs, and so on.
- Lens
- Octant
- Prometheus and Grafana
- vROps and Kubernetes Management Pack
- Kubebox
-Lens-
Download the Lens binary file from: https://k8slens.dev/
I am installing it on a Windows server. Once the installation is complete, the first thing you have to do is to provide the Kube config file details so that Lens can connect to the Kubernetes cluster and start monitoring it.
Add Cluster
Click File - Add Cluster
You can either browse and select the Kube config file or you can paste the content of your Kube config file as text. I am just pasting it as text.
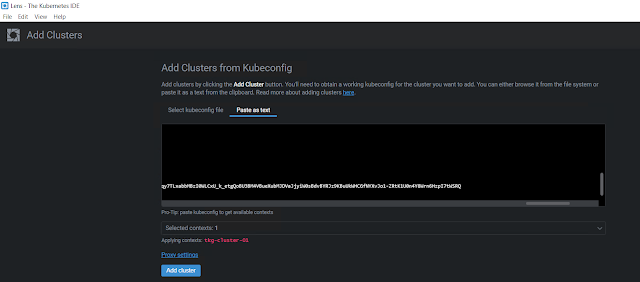
Once you have pasted your Kube config file contents, make sure to select the context, and then click Add cluster.
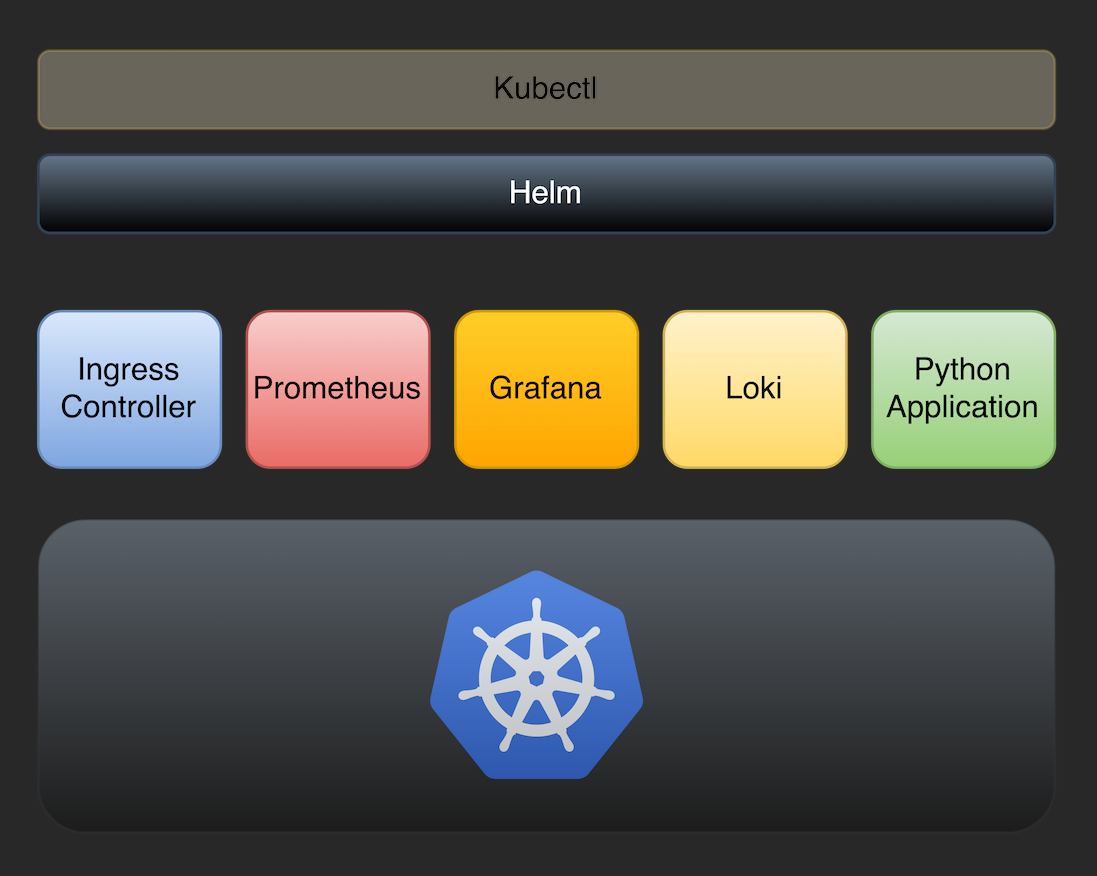
Deploy Prometheus stack
If you aren't seeing CPU and memory metrics, you will need to install the Prometheus stack on your K8s cluster. And Lens has a feature that deploys the Prometheus stack on your K8s cluster with the click of a button!
Select the cluster icon and click Settings.
Scroll all the way to the end, and under Features, you will find an Install button. In my case, I've already installed it, that's why it's showing the Uninstall button.
Once you click the Install button, Lens will go ahead and install the Prometheus stack on the selected K8s cluster. After few minutes, you should be able to see all the metrics.
You can see a namespace called "lens-metrics" and under that, the Prometheus stack components are deployed.
Following are the service objects that are created as part of the Prometheus stack deployment.
And, here is the PVC that is attached to the Prometheus pod.
Terminal access
Click on Terminal to get access directly to the K8s cluster.
Pod metrics, SSH to the pod, and container logs
Scaling
Note: In a production environment, it is always a best practice to apply configuration changes to your K8s cluster objects through a version control system.
You can also see the Service Accounts, Roles, Role Bindings, and PSPs under the Access Control tab. For more details see
https://docs.k8slens.dev/main/.
-Octant-
https://vineethac.blogspot.com/2020/08/visualize-your-kubernetes-clusters-and.html
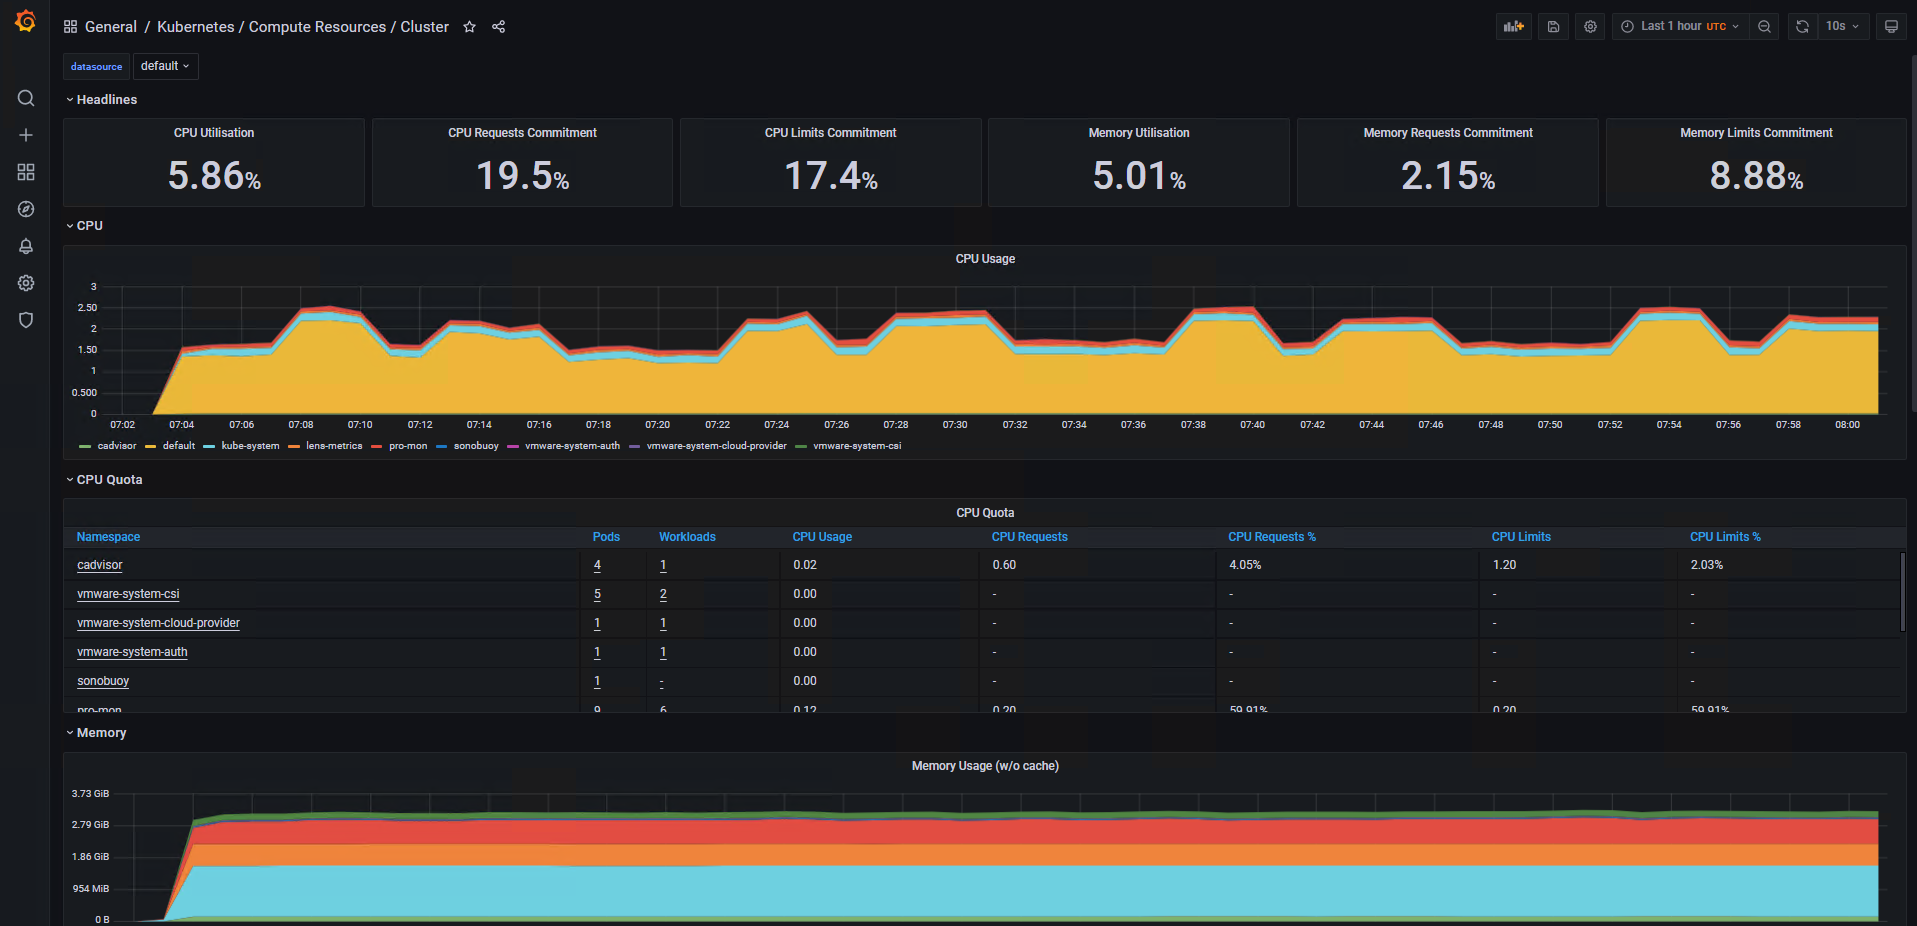
-Prometheus and Grafana-
-vROps and Kubernetes Management Pack-
https://blogs.vmware.com/management/2020/12/announcing-the-vrealize-operations-management-pack-for-kubernetes-1-5-1.html
https://rudimartinsen.com/2021/03/07/vrops-kubernetes-mgmt-pack/
https://www.brockpeterson.com/post/vrops-management-pack-for-kubernetes
-Kubebox-
curl -Lo kubebox https://github.com/astefanutti/kubebox/releases/download/v0.9.0/kubebox-linux && chmod +x kubebox
Select namespace
Select PodThis will show the selected pod metrics and logs.
Note: Kubebox relies on cAdvisor to retrieve the resource usage metrics. It’s recommended to use the provided cadvisor.yaml file, that’s tested to work with Kubebox.
kubectl apply -f https://raw.github.com/astefanutti/kubebox/master/cadvisor.yaml