Showing posts with label iometer. Show all posts

Friday, September 6, 2024

Revisiting Storage Performance Benchmarking

Few years ago, I had the opportunity to explore the intricacies of storage performance benchmarking using tools like FIO, DISKSPD, and Iometer. Those studies provided valuable insights into the performance characteristics of various storage solutions, shaping my understanding and approach to storage performance analysis. As I prepare for an upcoming project in this domain, I find it essential to revisit my previous work, reflect on the lessons learned, and share my experiences. This blog post aims to provide a comprehensive overview of my benchmarking journey and the evolving landscape of storage performance studies.


Recent advancements 

The field of storage technology has seen significant advancements in recent years. The rise of NVMe and storage-class memory technologies has also redefined high-end storage performance, offering unprecedented speed and efficiency. These advancements highlight the dynamic nature of storage performance benchmarking and underscore the importance of staying updated with the latest tools and methodologies.

Challenges

Benchmarking storage performance is not without its challenges. One of the primary difficulties is ensuring a consistent and controlled testing environment, as variations in hardware, software, and network conditions can significantly impact results. Another challenge is the selection of appropriate benchmarks that accurately reflect real-world workloads, which requires a deep understanding of the specific use cases and performance metrics. Additionally, interpreting the results can be complex, as it involves analyzing multiple metrics such as IOPS, throughput, and latency, and understanding their interplay. These challenges necessitate meticulous planning and a thorough understanding of both the benchmarking tools and the storage systems being tested.

Prior works

Following are some of the articles on storage benchmarking that I’ve published in the past:

Custom storage benchmarking framework

While there are numerous storage benchmarking tools available, such as VMFleet and HCIBench, I wanted to highlight a custom framework I developed a few years ago. Here are some reasons why we created this custom tool:

  • Great learning experience: It provided valuable insights into how things work.
  • Customization: Being a custom framework, it allows you to add or remove features as needed.
  • Flexibility: You can modify multiple parameters to suit your requirements.
  • Custom test profiles: You can create tailored storage test profiles.
  • No IP assignment needed: There’s no need for IP assignment or DHCP for the stress test VMs.
  • Centralized log collection: It offers centralized log collection for detailed analysis.


You can access the scripts and readme on my GitHub repository:

https://github.com/vineethac/vsan_cluster_storage_benchmarking_with_diskspd


Here is an overview.

  • Profile Manifest: All storage test profiles are listed in profile_manifest.psd1. You can define as many profiles as you want.
  • VM Template: A Windows VM template should be present in the vCenter server.
  • Benchmarking Manifest: Details of vCenter, cluster name, VM template, number of stress test VMs per host, etc., are provided in benchmarking_manifest.psd1.
  • Deploy Test VMs: deploy_test_vms.ps1 will deploy all the test VMs with pre-configured parameters.
  • Start Stress Test: start_stress_test.ps1 will initiate the storage stress test process for all the profiles mentioned in profile_manifest.psd1 one by one.
  • Log Collection: All log files will be automatically copied to a central location on the host from where these scripts are running.
  • Cleanup: Use delete_test_vms.ps1 to clean up the stress test VMs from the cluster.


Note:
 These scripts were created about five years ago, and I haven’t had the opportunity to refactor them according to current best practices and new PowerShell scripting standards. I plan to enhance them in the coming months!

This overview should provide you with a clear understanding of the overall process and workflow involved in the storage benchmarking process. I hope it was useful. Cheers!

Saturday, April 18, 2020

vSAN performance benchmarking

In this article, I will explain briefly on performance benchmarking considerations, factors affecting performance, and some of the best practices. We do performance benchmarking to understand the capabilities and bottlenecks of a system. When I say system it could be a storage system, CPU, GPU, network switch, etc. Now let's consider a VMware vSAN cluster infrastructure. It includes multiple components and each of these contributes to the performance. In this case, the vSAN cluster is the solution under test. We will have to conduct performance benchmarking to understand the storage performance behavior of the cluster. When I say storage behavior it includes the IOPS, latency, and throughput that the cluster can produce under varying loads.

The goal of benchmarking
  • Identify bottlenecks
    • Hardware bottleneck
    • Software bottleneck
    • Application bottleneck
  • Compare tradeoffs
  • Manage expectations
  • Make decisions

Usually in a real-world scenario, benchmarking will be done once the cluster is deployed/ ready and before starting to host production workload on top of it. As these benchmark values define the performance maximums it will be helpful to decide on when to scale or upgrade the cluster before it hits a bottleneck.

Fundamental factors of vSAN performance

Server hardware
  • Compatibility as per vSAN HCL
Host
  • Number of hosts in the cluster
  • Power settings
  • CPU - number of cores and frequency 
Storage
  • Hybrid or All-flash
  • NVMe, SAS, or SATA
  • Number of disk groups per host
  • Storage controller configuration
  • Compatibility of hardware devices as per vSAN HCL
Network
  • 10/ 25/ 40 GbE
  • MTU 
  • LAG
SPBM policy
  • FTT (Failures To Tolerate)
  • FTM (Mirroring/ Erasure coding)
  • Thin or Thick provision
Security
  • Encryption
  • Checksum
Other
  • Stripe width
  • Flash read cache reservation
  • IOPS limit for object
All of the above factors will affect performance. So you should know the benefits and tradeoffs. 

Benchmarking methodology

Image credit: VMware

Storage benchmarking tools

IO load generation tools
Application-specific tools
  • HammerDB (MSSQL, Oracle)
  • Jetstress (MS Exchange)
  • SLOB (Oracle)
  • DBGen (MSSQL, Oracle)

Best practices

  • Understand the production performance metrics.
  • Test what you plan to deploy.
  • Workload modeling.
  • Plan for use case testing.
  • Choose an appropriate size for benchmarking
  • Choose the right tool.
  • Pre-allocate blocks while testing.
  • Test for a longer time duration.
  • Deploy multiple VMs with multiple VMDKs.

References

Tuesday, February 28, 2017

Stress test your storage system using iometer

In this article I will explain briefly about how to use iometer for simulating I/O load. Here in my test a 600GB LUN is provisioned from a Compellent storage array and connected to an ESXI 6.5 server as a data store. I've created a VM with 2 disks (C and E for OS and data) on the 600GB data store. We will be using drive E (40 GB) for the test with NTFS partition having 4KB allocation unit size.

Parameters:

Disk Workers - 2 (that means 2 worker threads will run simultaneously during the test)
Disk Targets - Select drive E on both disk workers
Maximum Disk Size - 0 (entire drive E will be used for the test)
Rest all values - default


Network Targets - leave the settings as it is (as we are not doing network stress)

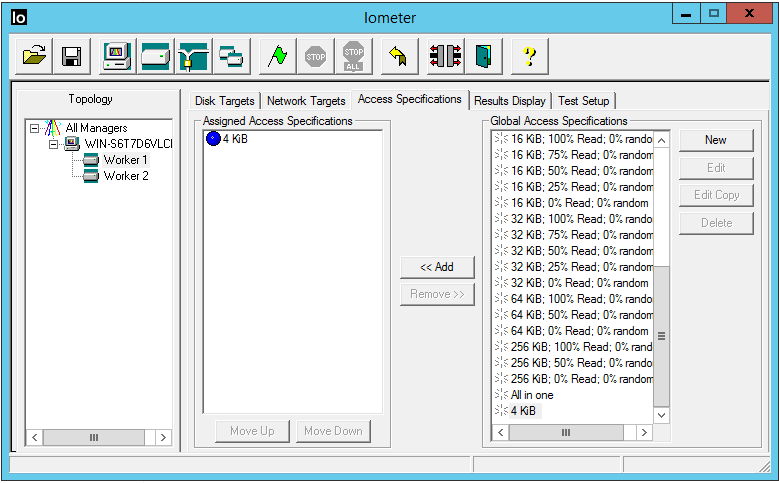
Access Specifications - it specifies the read/ write block size, percentage of read/ write, random/ sequential access etc.

Max IOPS at - 512 bytes transfer request size, 100% sequential, 100% reads
Max throughput at - 64K transfer request size, 100% sequential, 100% reads

In a real world situation it totally depends on the type of workloads. Here we are considering 4KB blocks, with 90% write, 10% read and 100% random access. These values are close to and are applicable to most virtualization workloads. 


Note: Make sure you add access specifications to all the disk workers

Transfer Request Size - 4KB
Percent Random/ Sequential Distribution - 100% Random
Percent Read/ Write Distribution - 90% Write
Rest all values - default


Once all the above settings are configured, you can click the green flag on the top to start the test. Now when you start it, you can see a test file (iobw.tst) will be created in drive E which will grow to the entire size of the disk (approx. 40GB). This is shown in the screenshots below.

Note: For creating a 40GB test file it takes few minutes

On the results display tab, set update frequency to 1 second to view real time results. You can also use the performance monitor tools to view disk reads and writes to cross check with the values of iometer.

Total I/Os per second = disk reads/ sec + disk writes/ sec


You can also monitor read/ write operations of your data store as shown below. These values should also match the results obtained from iometer and perfmon (as there is only one VM on this data store). In the below graph you can see the data store was almost idle as there was no operations on it. The moment I started iometer, it is creating iobw.tst file which is basically a 40GB write operation on drive E.


4KB reads and writes will happen on this test file (iobw.tst).


There is one more way you can monitor the IOPS value. While the iometer is running open resource monitor and observe disk activity generated by dynamo.exe. Make a note of total bytes. Convert it to Kilobytes and divide it by 4. This gives you the total IOPS which also should be close to values generated by iometer which is shown below.


ESXI performance graph is also shown below.


Final results:

iometer - 3799 IOPS
Perfmon - 372 + 3344 = 3716 IOPS
Disk activity monitor - (15291932 Bytes) 14933KB/ 4KB = 3733 IOPS
ESXI performance monitor - 373 + 3365 = 3738 IOPS

Note: To simulate a complex real world scenario or to benchmark your storage system you can provision multiple LUNs from the storage array, host few virtual machines on those LUNs and run iometer with different access specifications.  

Hope this article was useful to you. Cheers.