Showing posts with label Containers. Show all posts

Saturday, January 23, 2021

Benchmarking Kubernetes infrastructure using K-Bench

K-Bench is a framework to benchmark the control and data plane aspects of a Kubernetes cluster. More details are available at https://github.com/vmware-tanzu/k-bench. In my case, I am going to conduct this benchmarking study on a Tanzu Kubernetes cluster which is provisioned using Tanzu Kubernetes Grid service on a vSphere 7 U1 cluster.

Step 1: Clone the K-Bench repo

git clone https://github.com/vmware-tanzu/k-bench.git


Step 2: Install

./install.sh


Once the installation is done it will say, "Completed k-bench installation.".

Step 3: Run the benchmark

./run.sh


If you don't specify any test, then it is going to conduct the default set of tests. All sets of tests are defined under the config directory. If you browse to the config directory and list, there are separate folders specific to each test. You can see folders starting with cp and dp, and it refers to control plane and data plane related tests.


If no specific test is mentioned, then it is going to run all that is defined in the default directory. You can also see details of the test and results in the logs. The directories starting with "results" will have log files corresponding to each test run.


Following is a sample log that shows a summary of pod creation throughput, pod creation average latency, pod startup total latency, list/ update/ delete pod latency, etc.


Now, if you want to run a specific test case, you can do it as follows:
Usage: ./run.sh -r <run-tag> [-t <comma-separated-tests> -o <output-dir>]
DP network internode test

For example, you can run a data plane test to check the network performance between two nodes as shown below.

./run.sh -r "kbench-run-on-tkg-cluster-02"  -t "dp_network_internode" -o "./"


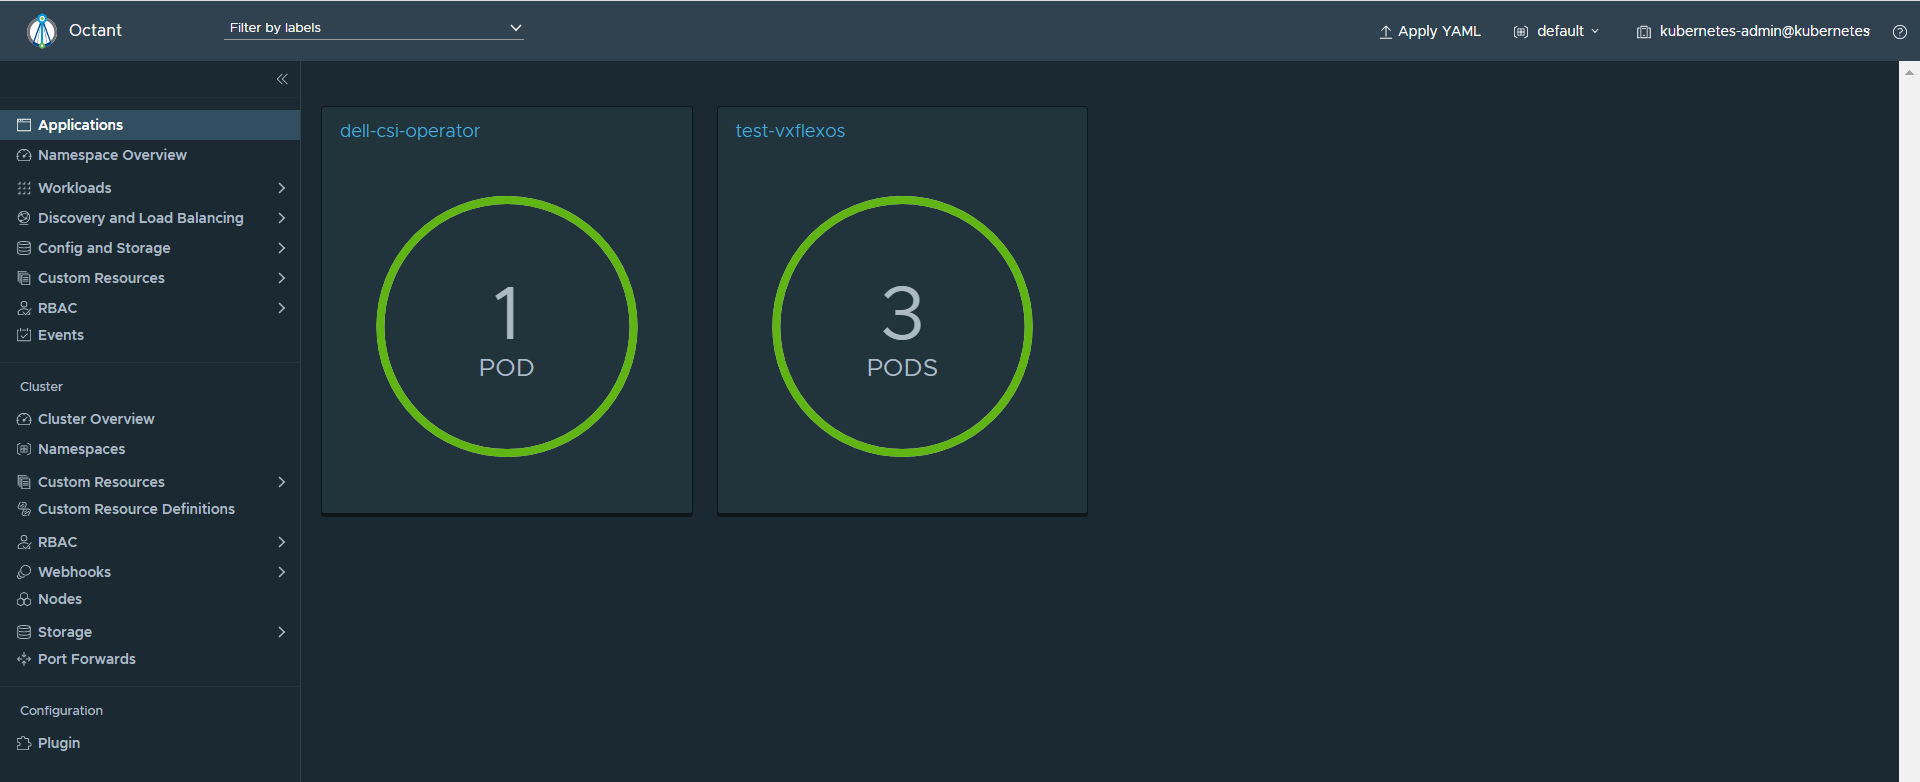
As soon as you run the above command, two pods will be created inside "kbench-pod-namespace" on two worker nodes as you see below.


It will then start "iperf3" process inside those two pods to create a network load following a client-server model as per the actions defined in the config.json file.


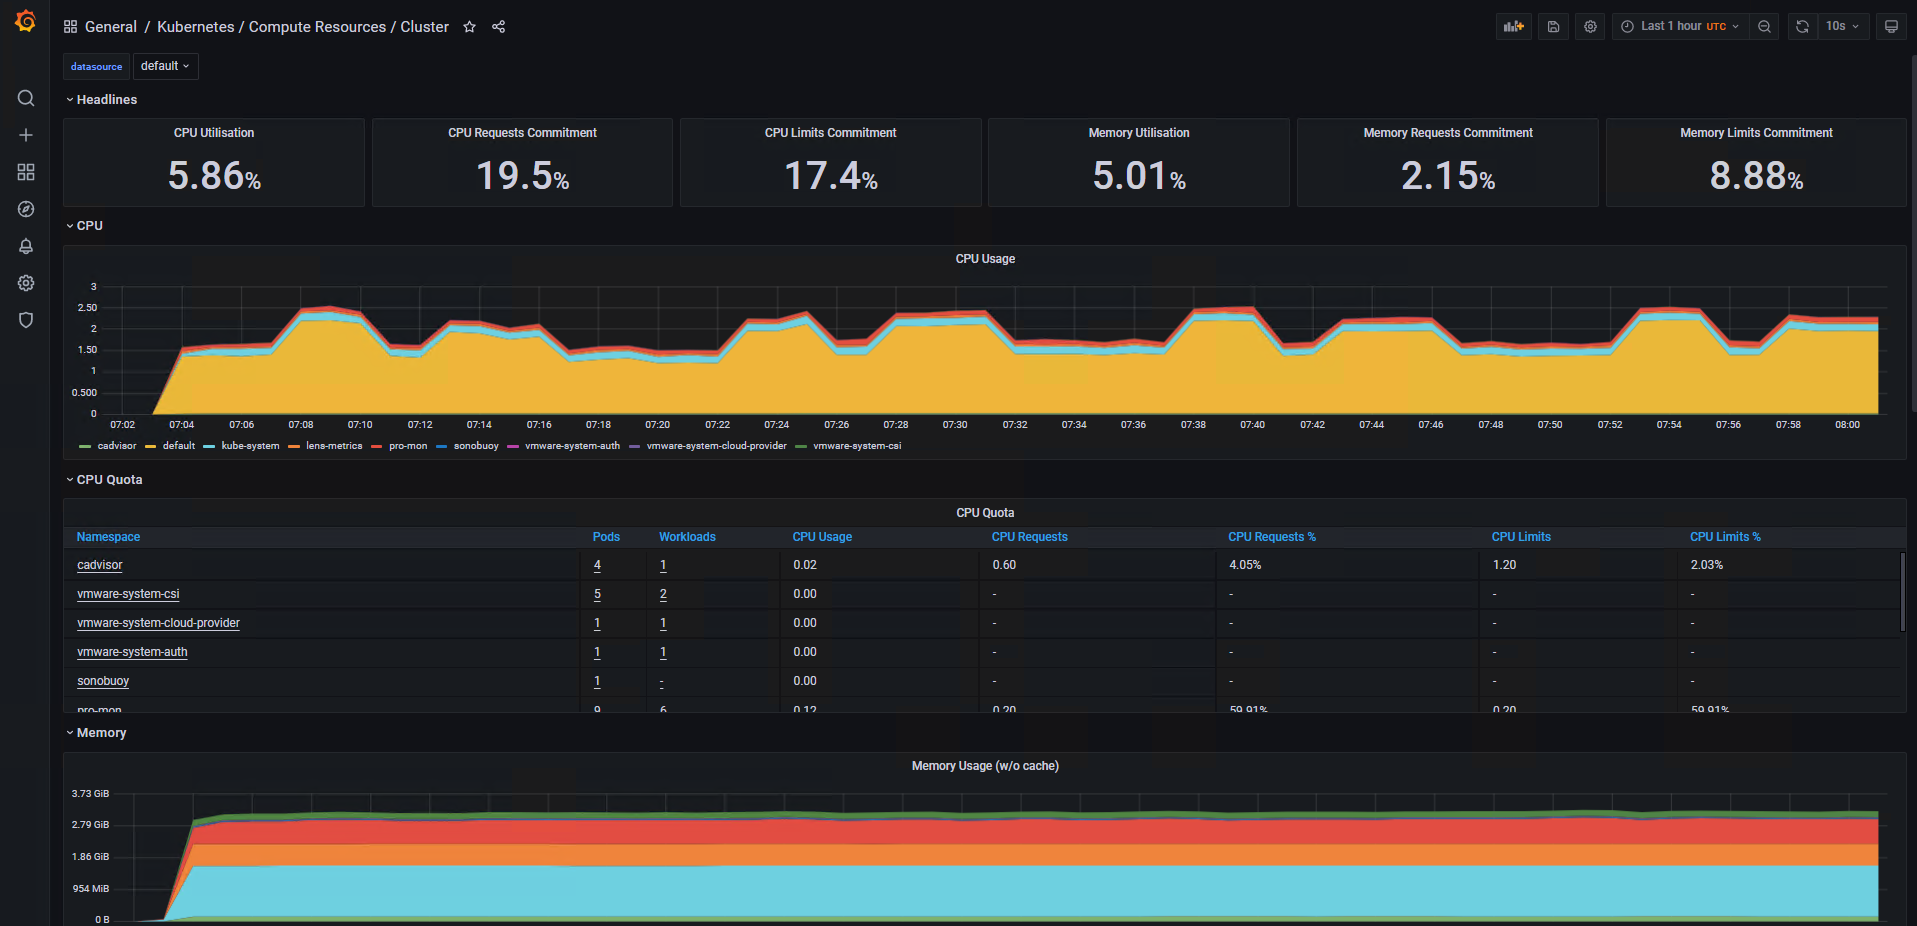
Sample logs are given below. It shows details like the amount of data transferred, transfer rate, network latency, etc.


Once the test run is complete, the pods and other resources created will be automatically deleted. Similarly, you can select the other set of tests that are pre-defined in the framework. I believe you have the flexibility to define custom test cases too as per your requirements. I hope it was useful. Cheers!

Related posts


Storage performance benchmarking of Tanzu Kubernetes clusters
Monitoring Tanzu Kubernetes cluster using Prometheus and Grafana


References


Sunday, September 27, 2020

Monitoring Tanzu Kubernetes cluster using Prometheus and Grafana

Updated: June 26, 2021

In this post, we will see how to deploy Prometheus and Grafana using Helm and Prometheus Operator to monitor Tanzu Kubernetes clusters. 


Following is my Tanzu K8s cluster setup:


Install Helm 3

curl https://raw.githubusercontent.com/kubernetes/helm/master/scripts/get-helm-3 > get_helm.sh
chmod 700 get_helm.sh
./get_helm.sh

Install Prometheus Operator using Helm

helm repo add prometheus-community https://prometheus-community.github.io/helm-charts
helm repo update
helm install pro-mon -n pro-mon prometheus-community/kube-prometheus-stack


Verify all


Port forward Grafana to 3000 to access the dashboards


Login to Grafana using a web browser at localhost:3000/login .

The default username is "admin" and the password is "prom-operator".


Go to Dashboards - Manage to view/ access the list of out-of-the-box K8s dashboards. The following are some of the sample dashboards.


Kubernetes | Compute Resources | Namespace (Pods)


Kubernetes | Networking | Namespace (Pods)


Kubernetes | API server


This is not limited to just Tanzu K8s clusters. You can also monitor OpenShift and Upstream K8s clusters following this method. Hope it was useful. Cheers!

References


https://github.com/prometheus-community/helm-charts/tree/main/charts/kube-prometheus-stack
[www.bogotobogo.com] Docker_Kubernetes_Prometheus_Deploy_using_Helm_and_Prometheus_Operator

Saturday, August 15, 2020

Visualize your Kubernetes clusters and workloads using Octant

In this article, I will explain how to visualize your Kubernetes clusters and workload using Octant.   


Download Octant


You can download the latest release of Octant from https://github.com/vmware-tanzu/octant/releases.

Friday, May 15, 2020

Kubernetes 101 - Part3 - Install kubectl on Windows

This article shows how to install kubectl on a Windows machine and connect to a remote Kubernetes cluster.

Open PowerShell as administrator and run the following:
Install-Script -Name install-kubectl -Scope CurrentUser -Force


This will download the installation files to Windows PowerShell script folder of the current user. In my case it is: C:\Users\vineetha\Documents\WindowsPowerShell\Scripts


Now browse to the above location in Powershell and execute the install-kubectl.ps1 file.
install-kubectl.ps1 [-DownloadLocation <path>]

Note: If you do not specify a DownloadLocationkubectl will be installed in the user's temp directory.