Saturday, December 30, 2023

GitOps using Argo CD - Part2 - Mini project

In the previous blog post, we discussed deploying Argo CD on a Kubernetes cluster and explored the fundamentals of application management. This time, we'll leverage Argo CD to deploy the applications from our Kubernetes mini project.

Full project in my GitHub

https://github.com/vineethac/Kubernetes/tree/main/gitops-argocd


Following are the different components of the project that will get deployed on to a Kubernetes cluster using the Argo CD application resource:
  1. Ingress controller
  2. Prometheus stack
  3. FastAPI web app
  4. FastAPI service monitor
  5. Loki stack


Deploy each of these components by applying the corresponding YAML manifest, following the outlined steps in the GitHub repository mentioned above. After the successful deployment of all components, you can observe them in the Argo CD web UI, as illustrated below.


Hope it was useful. Cheers!

Sunday, December 3, 2023

Kubernetes mini project

In this mini project, we are going to learn the following:

  • Deploy a simple Python based web application on a Kubernetes cluster.
  • We will use Helm to deploy this app.
  • This web app uses FastAPI and exposes some metrics using the Prometheus Python client.
  • To store and visualize these metrics we will deploy Prometheus and Grafana in the K8s cluster.
  • We will also deploy and use an ingress controller for exposing the web app, Prometheus, and Grafana to external users.
  • For logging we will deploy and use Grafana Loki stack.


Full project in my GitHub

High-level steps to complete this project

Step1: Write the Python app.

Step2: Create the Dockerfile for the app.

Step3: Create the container image.

Step4: Push the container image to an image registry like Docker Hub.

Step5: Get access to a K8s cluster.

Step6: Deploy an ingress controller.

Step7: Create the Helm chart for your app and deploy it to the K8s cluster.

Step8: Deploy Prometheus stack on the K8s cluster using Helm.

Step9: Create a servicemonitor resource which defines the target to be monitored by Prometheus.

Step10: Verify targets and service discovery in Prometheus.

Step11: Configure Grafana dashboard and verify.

Step12. Deploy Grafana Loki stack using Helm.


Hope it was useful. Cheers!

Saturday, November 18, 2023

vSphere with Tanzu using NSX-T - Part29 - Logging using Loki stack

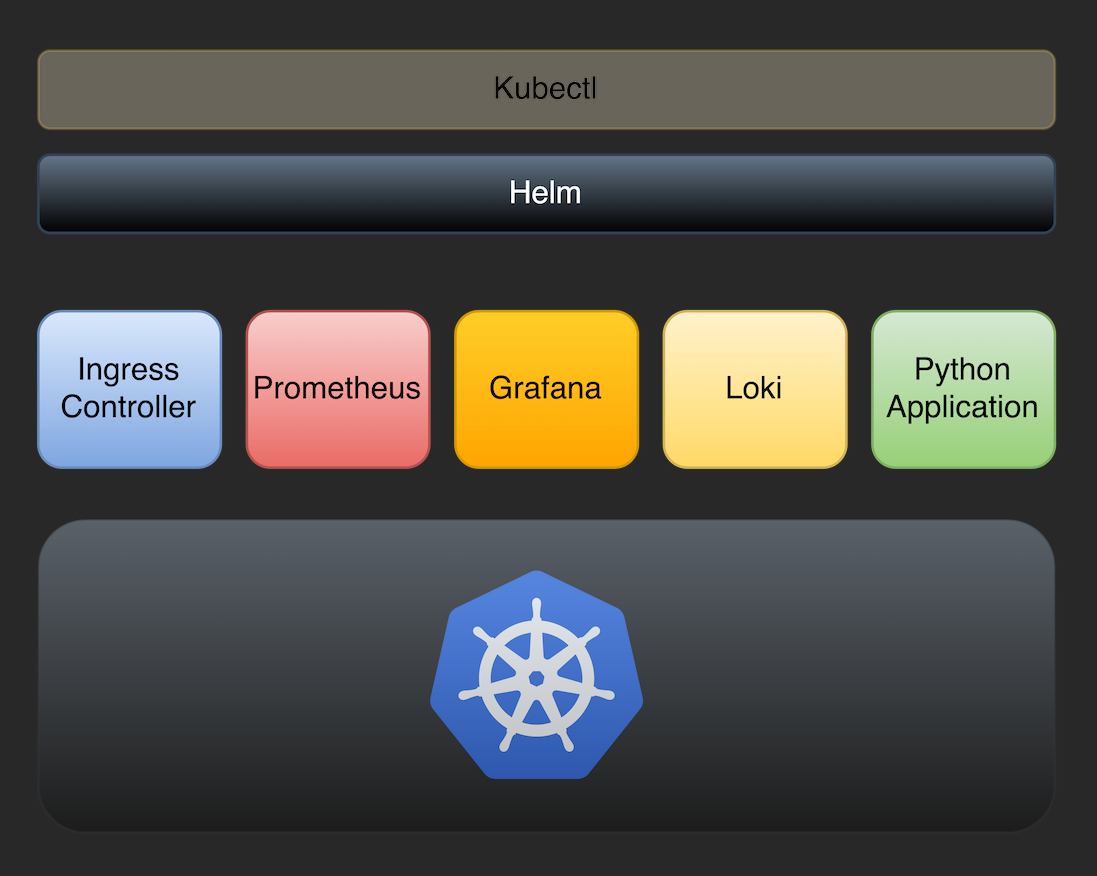
Grafana Loki is a log aggregation system that we can use for Kubernetes. In this post we will deploy Loki stack on a Tanzu Kubernetes cluster.

❯ KUBECONFIG=gc.kubeconfig kg no
NAME                                            STATUS   ROLES                  AGE    VERSION
tkc01-control-plane-k8fzb                       Ready    control-plane,master   144m   v1.23.8+vmware.3
tkc01-worker-nodepool-a1-pqq7j-76d555c9-4n5kh   Ready    <none>                 132m   v1.23.8+vmware.3
tkc01-worker-nodepool-a1-pqq7j-76d555c9-8pcc6   Ready    <none>                 128m   v1.23.8+vmware.3
tkc01-worker-nodepool-a1-pqq7j-76d555c9-rx7jf   Ready    <none>                 134m   v1.23.8+vmware.3
❯
❯ helm repo add grafana https://grafana.github.io/helm-charts
❯ helm repo update
❯ helm repo list
❯ helm search repo loki

I saved the values file using helm show values grafana/loki-stack and made necessary modifications as mentioned below. 

  • I enabled Grafana by setting enabled: true. This will create a new Grafana instance.
  • I also added a section under grafana.ingress in the loki-stack/values.yaml, that will create an ingress resource for this new Grafana instance.

 Here is the values.yaml file.

test_pod:
  enabled: true
  image: bats/bats:1.8.2
  pullPolicy: IfNotPresent

loki:
  enabled: true
  isDefault: true
  url: http://{{(include "loki.serviceName" .)}}:{{ .Values.loki.service.port }}
  readinessProbe:
    httpGet:
      path: /ready
      port: http-metrics
    initialDelaySeconds: 45
  livenessProbe:
    httpGet:
      path: /ready
      port: http-metrics
    initialDelaySeconds: 45
  datasource:
    jsonData: "{}"
    uid: ""


promtail:
  enabled: true
  config:
    logLevel: info
    serverPort: 3101
    clients:
      - url: http://{{ .Release.Name }}:3100/loki/api/v1/push

fluent-bit:
  enabled: false

grafana:
  enabled: true
  sidecar:
    datasources:
      label: ""
      labelValue: ""
      enabled: true
      maxLines: 1000
  image:
    tag: 8.3.5
  ingress:
    ## If true, Grafana Ingress will be created
    ##
    enabled: true

    ## IngressClassName for Grafana Ingress.
    ## Should be provided if Ingress is enable.
    ##
    ingressClassName: nginx

    ## Annotations for Grafana Ingress
    ##
    annotations: {}
      # kubernetes.io/ingress.class: nginx
      # kubernetes.io/tls-acme: "true"

    ## Labels to be added to the Ingress
    ##
    labels: {}

    ## Hostnames.
    ## Must be provided if Ingress is enable.
    ##
    # hosts:
    #   - grafana.domain.com
    hosts:
      - grafana-loki-vineethac-poc.test.com

    ## Path for grafana ingress
    path: /

    ## TLS configuration for grafana Ingress
    ## Secret must be manually created in the namespace
    ##
    tls: []
    # - secretName: grafana-general-tls
    #   hosts:
    #   - grafana.example.com

prometheus:
  enabled: false
  isDefault: false
  url: http://{{ include "prometheus.fullname" .}}:{{ .Values.prometheus.server.service.servicePort }}{{ .Values.prometheus.server.prefixURL }}
  datasource:
    jsonData: "{}"

filebeat:
  enabled: false
  filebeatConfig:
    filebeat.yml: |
      # logging.level: debug
      filebeat.inputs:
      - type: container
        paths:
          - /var/log/containers/*.log
        processors:
        - add_kubernetes_metadata:
            host: ${NODE_NAME}
            matchers:
            - logs_path:
                logs_path: "/var/log/containers/"
      output.logstash:
        hosts: ["logstash-loki:5044"]

logstash:
  enabled: false
  image: grafana/logstash-output-loki
  imageTag: 1.0.1
  filters:
    main: |-
      filter {
        if [kubernetes] {
          mutate {
            add_field => {
              "container_name" => "%{[kubernetes][container][name]}"
              "namespace" => "%{[kubernetes][namespace]}"
              "pod" => "%{[kubernetes][pod][name]}"
            }
            replace => { "host" => "%{[kubernetes][node][name]}"}
          }
        }
        mutate {
          remove_field => ["tags"]
        }
      }
  outputs:
    main: |-
      output {
        loki {
          url => "http://loki:3100/loki/api/v1/push"
          #username => "test"
          #password => "test"
        }
        # stdout { codec => rubydebug }
      }

# proxy is currently only used by loki test pod
# Note: If http_proxy/https_proxy are set, then no_proxy should include the
# loki service name, so that tests are able to communicate with the loki
# service.
proxy:
  http_proxy: ""
  https_proxy: ""
  no_proxy: ""

Deploy using Helm

❯ helm upgrade --install --atomic loki-stack grafana/loki-stack --values values.yaml --kubeconfig=gc.kubeconfig --create-namespace --namespace=loki-stack
WARNING: Kubernetes configuration file is group-readable. This is insecure. Location: gc.kubeconfig
WARNING: Kubernetes configuration file is world-readable. This is insecure. Location: gc.kubeconfig
Release "loki-stack" does not exist. Installing it now.
W1203 13:36:48.286498   31990 warnings.go:70] policy/v1beta1 PodSecurityPolicy is deprecated in v1.21+, unavailable in v1.25+
W1203 13:36:48.592349   31990 warnings.go:70] policy/v1beta1 PodSecurityPolicy is deprecated in v1.21+, unavailable in v1.25+
W1203 13:36:55.840670   31990 warnings.go:70] policy/v1beta1 PodSecurityPolicy is deprecated in v1.21+, unavailable in v1.25+
W1203 13:36:55.849356   31990 warnings.go:70] policy/v1beta1 PodSecurityPolicy is deprecated in v1.21+, unavailable in v1.25+
NAME: loki-stack
LAST DEPLOYED: Sun Dec  3 13:36:45 2023
NAMESPACE: loki-stack
STATUS: deployed
REVISION: 1
NOTES:
The Loki stack has been deployed to your cluster. Loki can now be added as a datasource in Grafana.

See http://docs.grafana.org/features/datasources/loki/ for more detail.


Verify

❯ KUBECONFIG=gc.kubeconfig kg all -n loki-stack
NAME                                     READY   STATUS    RESTARTS   AGE
pod/loki-stack-0                         1/1     Running   0          89s
pod/loki-stack-grafana-dff58c989-jdq2l   2/2     Running   0          89s
pod/loki-stack-promtail-5xmrj            1/1     Running   0          89s
pod/loki-stack-promtail-cts5j            1/1     Running   0          89s
pod/loki-stack-promtail-frwvw            1/1     Running   0          89s
pod/loki-stack-promtail-wn4dw            1/1     Running   0          89s

NAME                            TYPE        CLUSTER-IP       EXTERNAL-IP   PORT(S)    AGE
service/loki-stack              ClusterIP   10.110.208.35    <none>        3100/TCP   90s
service/loki-stack-grafana      ClusterIP   10.104.222.214   <none>        80/TCP     90s
service/loki-stack-headless     ClusterIP   None             <none>        3100/TCP   90s
service/loki-stack-memberlist   ClusterIP   None             <none>        7946/TCP   90s

NAME                                 DESIRED   CURRENT   READY   UP-TO-DATE   AVAILABLE   NODE SELECTOR   AGE
daemonset.apps/loki-stack-promtail   4         4         4       4            4           <none>          90s

NAME                                 READY   UP-TO-DATE   AVAILABLE   AGE
deployment.apps/loki-stack-grafana   1/1     1            1           90s

NAME                                           DESIRED   CURRENT   READY   AGE
replicaset.apps/loki-stack-grafana-dff58c989   1         1         1       90s

NAME                          READY   AGE
statefulset.apps/loki-stack   1/1     91s

❯ KUBECONFIG=gc.kubeconfig kg ing -n loki-stack
NAME                 CLASS   HOSTS                                 ADDRESS        PORTS   AGE
loki-stack-grafana   nginx   grafana-loki-vineethac-poc.test.com   10.216.24.45   80      7m16s
❯

Now in my case I've an ingress controller and dns resolution in place. If you don't have those configured, you can just port forward the loki-stack-grafana service to view the Grafana dashboard.

To get the username and password you should decode the following secret:

❯ KUBECONFIG=gc.kubeconfig kg secrets -n loki-stack loki-stack-grafana -oyaml

Login to the Grafana instance and verify the Data Sources section, and it must be already configured. Now click on explore option and use the log browser to query logs. 

Hope it was useful. Cheers!

Sunday, October 29, 2023

Kubernetes 101 - Part12 - Debug pod

While troubleshooting application connectivity and name resolution issues in Kubernetes we often have to access utilities like ping, nslookup, dig, traceroute, etc. Here is a container image that you can use in those cases. Following are some of the utilities that are pre-installed on this container image:

  • ping
  • dig
  • nslookup
  • traceroute
  • curl
  • wget
  • nc
  • netstat
  • ifconfig
  • route
  • host
  • arp
  • iostat
  • top
  • free
  • vmstat
  • pmap
  • mpstat
  • python3
  • pip


Run as a pod on Kubernetes

kubectl run debug --image=vineethac/debug -n default -- sleep infinity


Exec into the debug pod

kubectl exec -it debug -n default -- bash 
root@debug:/# ping 8.8.8.8 PING 8.8.8.8 (8.8.8.8) 56(84) bytes of data. 64 bytes from 8.8.8.8: icmp_seq=1 ttl=46 time=49.3 ms 64 bytes from 8.8.8.8: icmp_seq=2 ttl=45 time=57.4 ms 64 bytes from 8.8.8.8: icmp_seq=3 ttl=46 time=49.4 ms ^C --- 8.8.8.8 ping statistics --- 3 packets transmitted, 3 received, 0% packet loss, time 2003ms rtt min/avg/max/mdev = 49.334/52.030/57.404/3.799 ms root@debug:/#
root@debug:/# nslookup google.com Server: 10.96.0.10 Address: 10.96.0.10#53 Non-authoritative answer: Name: google.com Address: 142.250.72.206 Name: google.com Address: 2607:f8b0:4005:80c::200e root@debug:/# exit exit ❯


Reference

https://github.com/vineethac/Docker/tree/main/debug-image


Hope it was useful. Cheers!

Saturday, August 5, 2023

vSphere with Tanzu using NSX-T - Part28 - Create a custom VM Class

A VM class is a template that defines CPU, memory, and reservations for VMs. If you want to create a custom vmclass you can use dcli or vSphere UI. 

Following is an example using dcli:

❯ dcli +server vcenter-server-fqdn +skip-server-verification com vmware vcenter namespacemanagement virtualmachineclasses create --id best-effort-16xlarge --cpu-count 64 --memory-mb 131072

This will create a vmclass with 64 vCPUs and 128GB memory with no reservations.

❯ dcli +server vcenter-server-fqdn +skip-server-verification com vmware vcenter namespacemanagement virtualmachineclasses create --id guaranteed-16xlarge --cpu-count 64 --memory-mb 131072 --cpu-reservation 100 --memory-reservation 100

This will create a vmclass with 64 vCPUs and 128GB memory with 100% reservations.

Note: You will need to attach this newly created vmclass to a supervisor namespace to use it.

Here is the documentation reference: https://docs.vmware.com/en/VMware-vSphere/8.0/vsphere-with-tanzu-services-workloads/GUID-18C7B2E3-BCF5-488C-9C50-937E29BB0C48.html

Hope it was useful. Cheers!

Sunday, July 23, 2023

Kubernetes 101 - Part11 - Find Kubernetes nodes with DiskPressure

Following are two quick and easy ways to find Kubernetes nodes with disk pressure:

jq:


kubectl get nodes -o json | jq -r '.items[] | select(.status.conditions[].reason=="KubeletHasDiskPressure") | .metadata.name'


jsonpath:


kubectl get nodes -o jsonpath='{range .items[*]} {.metadata.name} {" "} {.status.conditions[?(@.type=="DiskPressure")].status} {" "} {"\n"}'


❯ kubectl get no
NAME                                 STATUS   ROLES                  AGE     VERSION
tkc-btvsm-72hz2                      Ready    control-plane,master   124d    v1.23.8+vmware.3
tkc-btvsm-79xtn                      Ready    control-plane,master   124d    v1.23.8+vmware.3
tkc-btvsm-klmjz                      Ready    control-plane,master   124d    v1.23.8+vmware.3
tkc-workers-2cmvm-5bfcc5c9cd-gmv6m   Ready    <none>                 5d17h   v1.23.8+vmware.3
tkc-workers-2cmvm-5bfcc5c9cd-m44sq   Ready    <none>                 5d17h   v1.23.8+vmware.3
tkc-workers-2cmvm-5bfcc5c9cd-mjjlk   Ready    <none>                 5d17h   v1.23.8+vmware.3
tkc-workers-2cmvm-5bfcc5c9cd-wflrl   Ready    <none>                 5d17h   v1.23.8+vmware.3
tkc-workers-2cmvm-5bfcc5c9cd-xnqvk   Ready    <none>                 5d17h   v1.23.8+vmware.3
❯
❯
❯ kubectl get nodes -o json | jq -r '.items[] | select(.status.conditions[].reason=="KubeletHasDiskPressure") | .metadata.name'
tkc-workers-2cmvm-5bfcc5c9cd-m44sq
tkc-workers-2cmvm-5bfcc5c9cd-wflrl
❯
❯ kubectl get nodes -o jsonpath='{range .items[*]} {.metadata.name} {" "} {.status.conditions[?(@.type=="DiskPressure")].status} {" "} {"\n"}'
 tkc-btvsm-72hz2   False
 tkc-btvsm-79xtn   False
 tkc-btvsm-klmjz   False
 tkc-workers-2cmvm-5bfcc5c9cd-gmv6m   False
 tkc-workers-2cmvm-5bfcc5c9cd-m44sq   True
 tkc-workers-2cmvm-5bfcc5c9cd-mjjlk   False
 tkc-workers-2cmvm-5bfcc5c9cd-wflrl   True
 tkc-workers-2cmvm-5bfcc5c9cd-xnqvk   False
 %
❯

Hope it was useful. Cheers!

Sunday, July 9, 2023

vSphere with Tanzu using NSX-T - Part27 - nullfinalizer kubectl plugin

I have seen many cases where the supervisor namespace gets stuck at Terminating phase waiting on finalization on some of its child resources. This plugin can be used for setting finalizer to null for all objects of a specified api resource under a supervisor namespace. It will be helpful in cleaning up supervisor namespaces stuck terminating phase and can be also used to clean up stale resources under a supervisor namespace.

kubectl-nullfinalizer

#!/bin/bash

Help()
{
   # Display Help
   echo "This plugin sets finalizer to null for specified resource in a namespace."
   echo "Usage: kubectl nullfinalizer SVNAMESPACE RESOURCENAME"
   echo "Example: kubectl nullfinalizer vineetha-svns01 pvc"
}

# Get the options
while getopts ":h" option; do
   case $option in
      h) # display Help
         Help
         exit;;
     \?) # incorrect option
         echo "Error: Invalid option"
         exit;;
   esac
done

kubectl get -n $1 $2 --no-headers | awk '{print $1}' | xargs -I{} kubectl patch -n $1 $2 {} -p '{"metadata":{"finalizers": null}}' --type=merge

Usage

  • Place the plugin in the system executable path.
  • I placed it in $HOME/.krew/bin in my laptop.
  • Once you copied the plugin to the proper path, you can make it executable by: chmod 755 kubectl-nullfinalizer .
  • After that you should be able to run the plugin as: kubectl nullfinalizer SUPERVISORNAMESPACE RESOURCENAME .


Example

Following is an exmaple of a supervisor namespace stuck at Terminating phase. While describe you can see that it is waiting on finalization. 

❯ k config current-context
wdc-08-vc07
❯ kg ns svc-sct-bot-dogfooding
NAME                     STATUS        AGE
svc-sct-bot-dogfooding   Terminating   584d

❯ kg ns svc-sct-bot-dogfooding -oyaml

status:
  conditions:
  - lastTransitionTime: "2023-09-26T04:45:21Z"
    message: All resources successfully discovered
    reason: ResourcesDiscovered
    status: "False"
    type: NamespaceDeletionDiscoveryFailure
  - lastTransitionTime: "2023-09-26T04:45:21Z"
    message: All legacy kube types successfully parsed
    reason: ParsedGroupVersions
    status: "False"
    type: NamespaceDeletionGroupVersionParsingFailure
  - lastTransitionTime: "2023-09-26T04:45:21Z"
    message: All content successfully deleted, may be waiting on finalization
    reason: ContentDeleted
    status: "False"
    type: NamespaceDeletionContentFailure
  - lastTransitionTime: "2023-09-26T04:45:21Z"
    message: 'Some resources are remaining: clusters.cluster.x-k8s.io has 1 resource
      instances, kubeadmcontrolplanes.controlplane.cluster.x-k8s.io has 1 resource
      instances, machines.cluster.x-k8s.io has 4 resource instances, persistentvolumeclaims.
      has 9 resource instances, projects.registryagent.vmware.com has 1 resource instances,
      tanzukubernetesclusters.run.tanzu.vmware.com has 1 resource instances'
    reason: SomeResourcesRemain
    status: "True"
    type: NamespaceContentRemaining
  - lastTransitionTime: "2023-09-26T04:45:21Z"
    message: 'Some content in the namespace has finalizers remaining: cluster.cluster.x-k8s.io
      in 1 resource instances, cns.vmware.com/pvc-protection in 9 resource instances,
      controller-finalizer in 1 resource instances, kubeadm.controlplane.cluster.x-k8s.io
      in 1 resource instances, machine.cluster.x-k8s.io in 4 resource instances, tanzukubernetescluster.run.tanzu.vmware.com
      in 1 resource instances'
    reason: SomeFinalizersRemain
    status: "True"
    type: NamespaceFinalizersRemaining
  phase: Terminating

❯ kg pvc -n svc-sct-bot-dogfooding
NAME                                 STATUS        VOLUME                                     CAPACITY   ACCESS MODES   STORAGECLASS              AGE
gc1-workers-r9jvb-4sfjc-containerd   Terminating   pvc-0d9f4a38-86ad-41d8-ab11-08707780fd85   70Gi       RWO            wdc-08-vc07c01-wcp-mgmt   538d
gc1-workers-r9jvb-szg9r-containerd   Terminating   pvc-ca6b6ec4-85fa-464c-abc6-683358994f3f   70Gi       RWO            wdc-08-vc07c01-wcp-mgmt   538d
gc1-workers-r9jvb-zbdt8-containerd   Terminating   pvc-8f2b0683-ebba-46cb-a691-f79a0e94d0e2   70Gi       RWO            wdc-08-vc07c01-wcp-mgmt   538d
gc2-workers-vpzl2-ffkgx-containerd   Terminating   pvc-69e64099-42c8-44b5-bef2-2737eca49c36   70Gi       RWO            wdc-08-vc07c01-wcp-mgmt   510d
gc2-workers-vpzl2-hww5v-containerd   Terminating   pvc-5a909482-4c95-42c7-b55a-57372f72e75f   70Gi       RWO            wdc-08-vc07c01-wcp-mgmt   510d
gc2-workers-vpzl2-stsnh-containerd   Terminating   pvc-ed7de540-72f4-4832-8439-da471bf4c892   70Gi       RWO            wdc-08-vc07c01-wcp-mgmt   510d
gc3-workers-2qr4c-64xpz-containerd   Terminating   pvc-38478f19-8180-4b9b-b5a9-8c06f17d0fbc   70Gi       RWO            wdc-08-vc07c01-wcp-mgmt   510d
gc3-workers-2qr4c-dpng5-containerd   Terminating   pvc-a8b12657-10bd-4993-b08e-51b7e9b259f9   70Gi       RWO            wdc-08-vc07c01-wcp-mgmt   538d
gc3-workers-2qr4c-wfvvd-containerd   Terminating   pvc-01c6b224-9dc0-4e03-b87e-641d4a4d0d95   70Gi       RWO            wdc-08-vc07c01-wcp-mgmt   538d

❯ k nullfinalizer -h
This plugin sets finalizer to null for specified resource in a namespace.
Usage: kubectl nullfinalizer SVNAMESPACE RESOURCENAME
Example: kubectl nullfinalizer vineetha-svns01 pvc


❯ k nullfinalizer svc-sct-bot-dogfooding pvc
persistentvolumeclaim/gc1-workers-r9jvb-4sfjc-containerd patched
persistentvolumeclaim/gc1-workers-r9jvb-szg9r-containerd patched
persistentvolumeclaim/gc1-workers-r9jvb-zbdt8-containerd patched
persistentvolumeclaim/gc2-workers-vpzl2-ffkgx-containerd patched
persistentvolumeclaim/gc2-workers-vpzl2-hww5v-containerd patched
persistentvolumeclaim/gc2-workers-vpzl2-stsnh-containerd patched
persistentvolumeclaim/gc3-workers-2qr4c-64xpz-containerd patched
persistentvolumeclaim/gc3-workers-2qr4c-dpng5-containerd patched
persistentvolumeclaim/gc3-workers-2qr4c-wfvvd-containerd patched


❯ kg projects.registryagent.vmware.com -n svc-sct-bot-dogfooding
NAME                     AGE
svc-sct-bot-dogfooding   584d

❯ k nullfinalizer -h
This plugin sets finalizer to null for specified resource in a namespace.
Usage: kubectl nullfinalizer SVNAMESPACE RESOURCENAME
Example: kubectl nullfinalizer vineetha-svns01 pvc

❯ k nullfinalizer svc-sct-bot-dogfooding projects.registryagent.vmware.com
project.registryagent.vmware.com/svc-sct-bot-dogfooding patched


❯ kg ns svc-sct-bot-dogfooding
Error from server (NotFound): namespaces "svc-sct-bot-dogfooding" not found


Hope it was useful. Cheers!