Tuesday, February 28, 2017

Stress test your storage system using iometer

In this article I will explain briefly about how to use iometer for simulating I/O load. Here in my test a 600GB LUN is provisioned from a Compellent storage array and connected to an ESXI 6.5 server as a data store. I've created a VM with 2 disks (C and E for OS and data) on the 600GB data store. We will be using drive E (40 GB) for the test with NTFS partition having 4KB allocation unit size.

Parameters:

Disk Workers - 2 (that means 2 worker threads will run simultaneously during the test)
Disk Targets - Select drive E on both disk workers
Maximum Disk Size - 0 (entire drive E will be used for the test)
Rest all values - default


Network Targets - leave the settings as it is (as we are not doing network stress)

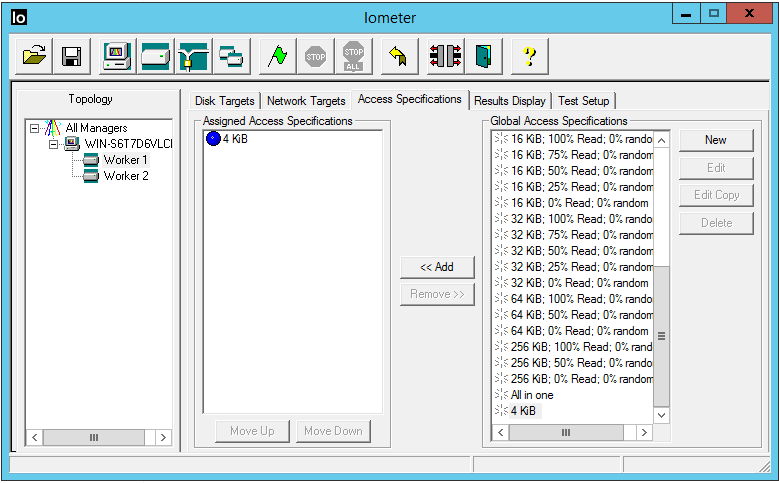
Access Specifications - it specifies the read/ write block size, percentage of read/ write, random/ sequential access etc.

Max IOPS at - 512 bytes transfer request size, 100% sequential, 100% reads
Max throughput at - 64K transfer request size, 100% sequential, 100% reads

In a real world situation it totally depends on the type of workloads. Here we are considering 4KB blocks, with 90% write, 10% read and 100% random access. These values are close to and are applicable to most virtualization workloads. 


Note: Make sure you add access specifications to all the disk workers

Transfer Request Size - 4KB
Percent Random/ Sequential Distribution - 100% Random
Percent Read/ Write Distribution - 90% Write
Rest all values - default


Once all the above settings are configured, you can click the green flag on the top to start the test. Now when you start it, you can see a test file (iobw.tst) will be created in drive E which will grow to the entire size of the disk (approx. 40GB). This is shown in the screenshots below.

Note: For creating a 40GB test file it takes few minutes

On the results display tab, set update frequency to 1 second to view real time results. You can also use the performance monitor tools to view disk reads and writes to cross check with the values of iometer.

Total I/Os per second = disk reads/ sec + disk writes/ sec


You can also monitor read/ write operations of your data store as shown below. These values should also match the results obtained from iometer and perfmon (as there is only one VM on this data store). In the below graph you can see the data store was almost idle as there was no operations on it. The moment I started iometer, it is creating iobw.tst file which is basically a 40GB write operation on drive E.


4KB reads and writes will happen on this test file (iobw.tst).


There is one more way you can monitor the IOPS value. While the iometer is running open resource monitor and observe disk activity generated by dynamo.exe. Make a note of total bytes. Convert it to Kilobytes and divide it by 4. This gives you the total IOPS which also should be close to values generated by iometer which is shown below.


ESXI performance graph is also shown below.


Final results:

iometer - 3799 IOPS
Perfmon - 372 + 3344 = 3716 IOPS
Disk activity monitor - (15291932 Bytes) 14933KB/ 4KB = 3733 IOPS
ESXI performance monitor - 373 + 3365 = 3738 IOPS

Note: To simulate a complex real world scenario or to benchmark your storage system you can provision multiple LUNs from the storage array, host few virtual machines on those LUNs and run iometer with different access specifications.  

Hope this article was useful to you. Cheers.

Tuesday, January 31, 2017

Virtual Link Trunking - VLT

VLT is a proprietary layer-2 link aggregation protocol developed by Force10 which allows users to setup aggregated links between end devices (servers) to two different physical switches. The main property is that after enabling VLT, the two physical switches will act as a single logical switch. This offers redundancy for the connection from server and balanced traffic to the core network eliminating packet loops. 

In dynamic link aggregation protocol like LACP, the connections from a server can be only be terminated to a single logical switch (it can be a single physical switch or multiple switches in a single stacked switch setup). There wont be any redundancy if the aggregated links terminate to a single physical switch and the disadvantage of a switch stack is that incase of maintenance or firmware update the whole stack needs to be taken offline causing downtime which is not practical in a production environment.


The VLT peers exchange and synchronize layer-2 related table details (MAC tables, IGMP states etc) among the whole VLT domain. Devices connected to the VLT domain could be either servers or switches as long as they support port channel (LAG, LACP etc). It is recommended to enable RSTP and configure bridge priorities. Prefer static LAG between VLT peers and LACP towards hosts/ switches.

Configuration steps:

1.Enable RSTP and configure bridge priority on peer VLT switches
2.Configure VLT interconnect (VLTi), static LAG between VLT switches
3.Configure VLT domain
4.Configure LACP for the connected device
5.Verify status


Tuesday, December 27, 2016

Highly Available SOFS On Clustered Storage Spaces

This article explains briefly about the design and steps required to deploy a highly available scale-out-file server (SOFS) on clustered storage spaces using Windows Server 2012 R2. 

Note: Here we are using only a single JBOD. But there are several storage spaces certified JBODs available in market (eg: DATAON) which are enclosure aware. That means when you are using multiple JBODs together, you will have data redundancy at the JBOD level too. 


  1. JBOD is connected to both file servers using shared SAS HBA connectors
  2. MPIO is enabled on both servers (SERVER 01/ 02)
  3. Make sure JBOD disks are available to both servers
  4. In this case we have total 24 disks (6 SSD and 18 SAS HDD)
  5. Create new storage pool
    1. By default all available disks are included in a pool named the primodial pool
    2. If primodial pool is not listed under storage spaces, then it indicates that the storage doesn't meet requirements of storage spaces
    3. If you select primodial pool, all available disks will be listed under physical disks
    4. Select option create new storage pool
    5. Give it a name
    6. Select physical disks you want to be in the pool
    7. Hot spares can be configured too at this stage
  6. Verify new storage pool is listed under storage pools
  7. Next step is to create virtual disks (these are not vhdx files, they call called spaces)
    1. Now select the new storage pool that you have just created in step 5
    2. Click on tasks, select new virtual disk
    3. Give a name
    4. Select the storage layout (Mirror, Parity, Simple)
    5. Choose provisioning type (Thin, Fixed)
    6. Specify size
  8. Now create volumes
    1. Right click the virtual disk (space) that you have just created in the previous step and select new volume
    2. Select server name and then the virtual disk name
    3. Specify volume size, drive letter, file system type, allocation unit size and volume label 
  9. Create failover cluster using the 2 file servers
    1. Provide a cluster name
    2. Volumes that you created in step 8 will be listed as available volumes
    3.  Add those as cluster shared volumes
    4. Now it appears in C:\ClusterStorage\
  10. Next step is to create a highly available SOFS
    1. On failover cluster manager - roles - new clustered role - file server - file server for scale out application data (SOFS) 
    2. Provide client access point name (eg: SMB-FS01)
    3. Right click on SOFS role in failover cluster manager and select add shared folder
    4. Choose SMB share server applications
    5. Provide a name (eg: DATA01)
    6. Local path to share (C:\ClusterStorage\volume1\shares\DATA01
    7. Remote path to share (\\SMB-FS01\DATA01)
Now you have a highly available file share (\\SMB-FS01\DATA01) to store your virtual machine files which is built over clustered storage spaces.

Reference: Microsoft 

Monday, December 5, 2016

Generic Storage System Architecture


The above diagram shows a generic stand-alone storage system architecture, where a storage OS is installed over a bare metal server and thus making it a storage server. Here I am using an enterprise class storage OS named Open-E DSS V7 which is installed on a Dell PowerEdge R720xd. R720xd can have up to twelve 3.5" drives at the front plus two 2.5" drives at the rear. Here in the diagram, the last 2 disks (Disk Group03) are 2.5" drives installed at the rear and being used as OS drive in RAID1. Apart from that we have five SAS 7.2K and 15K disks that are grouped into two RAID groups. Comparing the disk IOPS 'Disk Group01' can be considered fast and 'Disk Group02' as slow.

As I haven't mentioned the size of each SAS disk, lets assume using 'Disk Group01' a 10TB RAID5 virtual disk (VD) is created and using 'Disk Group02' a 12TB RAID5 VD is created. You can configure hot spares for each disk group if you have additional disks. As I mentioned above, for OS installation we have created a 10GB RAID1 VD using 'Disk Group03'. After installation of the OS (Open-E DSS V7), it scans and shows 10TB and 12TB as available storage units. 

Now the next step is to create volume groups. Here we created two volume groups (VG00 and VG01) to differentiate fast and slow storage. 

  • VG00 uses VD01
  • VG01 uses VD02
Once volume groups are created, you can now carve out LUNs separately based on your requirements. For example, if you want a LUN that is going to be used as a datastore to store your virtual machines, then you can create it on VG00 (fast), or if you need it for storing some general purpose backup files, then you can create it on VG01 (slow). So depending on your requirement you can decide where to create your LUN.

Note: Here I classified RAID disk groups based on speed. You can divide it based on reads and writes. So that you can choose RAID10 disk group for write intensive operations and RAID5 disk group for reads. It can even be divided based on access type. That means a disk group exclusively for sequential file access (SQL logs) and another disk group for random access (SQL data, VM datastore etc). 

Monday, November 14, 2016

Best practices while virtualizing Microsoft SQL servers using Hyper-V

-Limit min and max memory for SQL server
-Use fixed size VHDX
-Split data and log files into separate VHDX disks
-Use multiple SCSI controllers
-Right sizing and not over allocating resources
-Making use of multiple RAID disk groups (for sequential and random access)
-For tier-1 mission critical applications use RAID 10 for data, log files, and tempDB for best performance and availability
-For lower tier SQL workloads when cost is a concern, data and tempDB can be on RAID 5
-Use of SSDs or tiered storage for higher IOPS
-If using VMQ on Hyper-V environment, on the guest OS side you can enable vRSS for processing network load across multiple CPUs
-I prefer using fixed size memory for SQL VMs
-Exclude SQL DB related files  from (*.mdf, *.ldf, *.ndf, *.bak, *.trn) on access antivirus scan
-Disable content indexing on SQL data/ log/ tempDB drives
-Enable lock pages in memory (group policy setting)
-DB IFI (Instant File Initialization)
-Set OS power plan to high performance
-OS performance options - visual effects - adjust for best performance

Wednesday, October 26, 2016

3 Node Hyper-V 2012 R2 Cluster Design

Below diagram shows a traditional 3 tier highly available cluster with 3 Hyper-V nodes and 2 shared storage nodes (storage in Active-Passive/ Active-Active mode) all connected via network switches.

Compute

*Hyper-V nodes are running on DELL PowerEdge R630 rack servers

Networking

*Shared storage is accessed via MPIO over two separate VLANs (61 and 62)
*VM traffic is over NIC teaming (Switch independent and dynamic)
*Live migration/ cluster network is also teamed together

Storage

*We are using DELL PowerEdge R320 with Open-E DSS V7 as storage nodes
*Each node has 8 x 10K SAS drives with RAID 5
*Storage can be either in Active-Passive/ Active-Active cluster mode
*In Active-Passive mode, only one of the storage nodes will be active. That means resources of only one storage node will be utilized at a time
*In Active-Active mode, both servers will be active and serving storage traffic 


Saturday, October 15, 2016

Powershell script to monitor Azure AD Sync Scheduler status

Following powershell script will hep you to monitor status of AAD Sync Scheduler. Recently we had a requirement to monitor AAD Sync Scheduler status, where we had 2 servers. Primary and secondary. On both primary and secondary servers SyncCycleEnabled is set to True. On primary IsStagingModeEnabled is set to False and on secondary the same is set to True. AAD Sync Scheduler helps in synchronising changes happening in your on-premises directory to Azure AD. To view current configuration settings and status you can use Get-ADSyncScheduler .

Primary server:
SyncCycleEnabled - True
IsStagingModeEnabled  - False

Secondary server:
SyncCycleEnabled - True
IsStagingModeEnabled  - True

Any changes to the above states will have to trigger a warning message. The server in staging mode (secondary server in our case) is active for import and synchronisation, but it doesn't run any exports. A server in staging mode (secondary) continues to receive changes from Active Directory and Azure AD. It always has a copy of the latest changes and can be failed over to become primary. If you make configuration changes to your primary server, it is your responsibility to make the same changes to the server in staging mode. SyncCycleEnabled : True, indicates that the scheduler is running the import, sync and export processes as part of its operation. So its important to monitor the status of it at regular intervals.  

Script

$localcyclestatus = Get-ADSyncScheduler | select -ExpandProperty SyncCycleEnabled
$localstagingstatus = Get-ADSyncScheduler | select -ExpandProperty StagingModeEnabled

if($localcyclestatus -eq $True -and $localstagingstatus -eq $False)
{
Send-MailMessage -SmtpServer "smtp01.xyz.com" -Subject "AAD Sync Scheduler Operating Normally on Primary Server" -Body "AAD Sync Scheduler Operating Normally on Primary Server" -From "primary@xyz.com" -To "alert@xyz.com"
}

else
{
Send-MailMessage -SmtpServer "smtp01.xyz.com" -Subject “AAD Sync Scheduler Warning on Primary Server” -Body "AAD Sync Scheduler Warning on Primary Server" -From "primary@xyz.com" -To "alert@xyz.com"
}


Similarly, to monitor the secondary server you just have to edit the if check statement. That is, SyncCycleEnabled and StagingModeEnabled will be True. If not trigger a warning email. You can run the script locally, or can execute it remotely using "invoke-command". For monitoring the Sync status in regular intervals you can configure it as a Windows schedule task.

Reference: Microsoft