Pester provides a framework to test PowerShell code. Now, you might have a question, "Why to invest time to test your code? What's the point?". Yes, testing the code will take some time. But in a long run it will provide you a reliable code, prevents regression bugs, you have a clear definition of what is "working", you can trust your code and will help you develop better coding practices. You can also use Pester to test and validate your infrastructure. This is what I will be explaining in the article.
Thanks to my friend Deepak
dexterposh.com for helping me kick-start Pester and pointing me in the right direction.
Infrastructure testing is nothing but reading/ fetching the current state of the infrastructure and compare it with a known or expected state. Below diagram explains this.

The real benefits of testing your infrastructure is that you have a clear-cut definition of the expected states, helps you quickly point out if something deviates from the expected behavior and finally you will have reliable deployments. You can perform infrastructure testing right after a change is implemented. This simply means the test will validate the environment to make sure everything is working as expected.
Pester module is available on Windows Server 2016 and Windows 10 by default. You can verify the version of Pester installed using: Get-Module -ListAvailable -Name Pester
To find the most recent version of Pester from PSGallery: Find-Module -Name Pester
To install the required version: Install-Module -Name Pester -RequiredVersion 4.1.1 -Force
Now, lets get into infrastructure testing. The first thing you will need to have is a set of things that you need to test and their expected behavior. Lets have a look at the syntax and some simple examples.
Syntax:
Describe "***text***" {
Context "***text***" {
It "***text***" {
## actual test will be written here
}
}
}
"Describe" block is a grouping of individual tests. The tests are actually defined in "It" blocks. A describe block can have multiple it blocks. "Context" blocks serve as logical groups. It is like sub grouping. Multiple context blocks inside a describe block is also possible.
Should is a command used inside It blocks to compare objects and there are several should operators such as: Be, BeExactly, BeLike, Match etc. Some of them are used in the below examples. Visit
GitHub Pester Wiki for command references.
Examples:
--------------------------------------------------------------------------------------------------
#Example 1
#Verify the file system type and allocation unit size (AUS) of a drive in a machine
#Expected state: Drive D - File system type should be REFS and AUS should be 4K (4096 Bytes)
Describe "Verify drive D" {
Context "Check file system type and AUS" {
It "Should be REFS" {
$drive_stat = fsutil fsinfo statistics D:
($drive_stat[0]) -match ([regex]::Escape("File System Type : REFS")) | Should Be $true
}
It "Should have 4K AUS" {
$AUS_stat = fsutil fsinfo refsinfo D:
($AUS_stat[8]) -match ([regex]::Escape("Bytes Per Cluster : 4096")) | Should Be $true
}
}
}
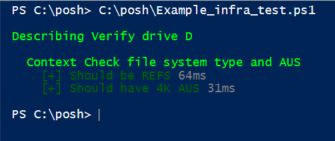
Output:
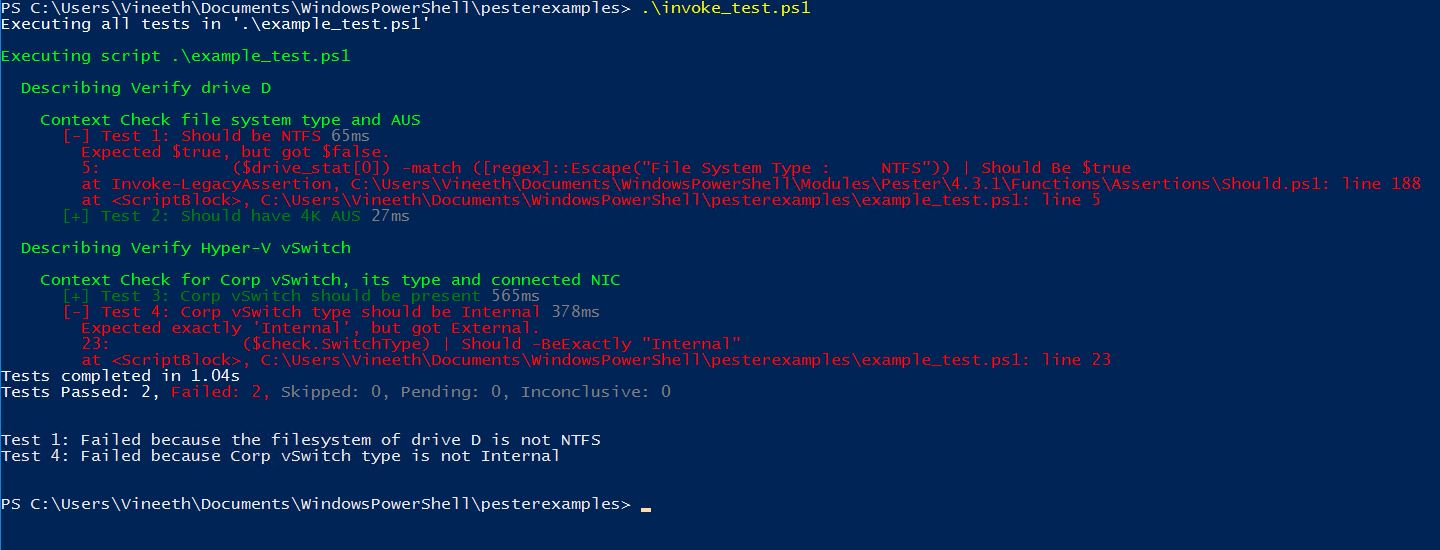
Here you can see the test passed (Green!) as drive D is having REFS file system and AUS 4K.
--------------------------------------------------------------------------------------------------
#Example 2
#Check presence of Hyper-V virtual switch named "Corp"
#Verify the vSwitch type and the network adapter associated with it
#Expected state: vSwitch named "Corp" should have connection to external network and should be using network adapter "QLogic BCM57800 Gigabit Ethernet (NDIS VBD Client) #44"
Describe "Verify Hyper-V vSwitch" {
Context "Check for Corp vSwitch, its type and connected NIC" {
$check = Get-VMSwitch | where name -eq Corp
It "Corp vSwitch should be present" {
($check.Name) | Should -BeExactly "Corp"
}
It "Corp vSwitch type should be External" {
($check.SwitchType) | Should -BeExactly "External"
}
It "Corp vSwitch should be connected to QLogic BCM57800 Gigabit Ethernet (NDIS VBD Client) #44" {
($check.NetAdapterInterfaceDescription) | Should -BeExactly "BCM57800 Gigabit Ethernet (NDIS VBD Client) #44"
}
}
}
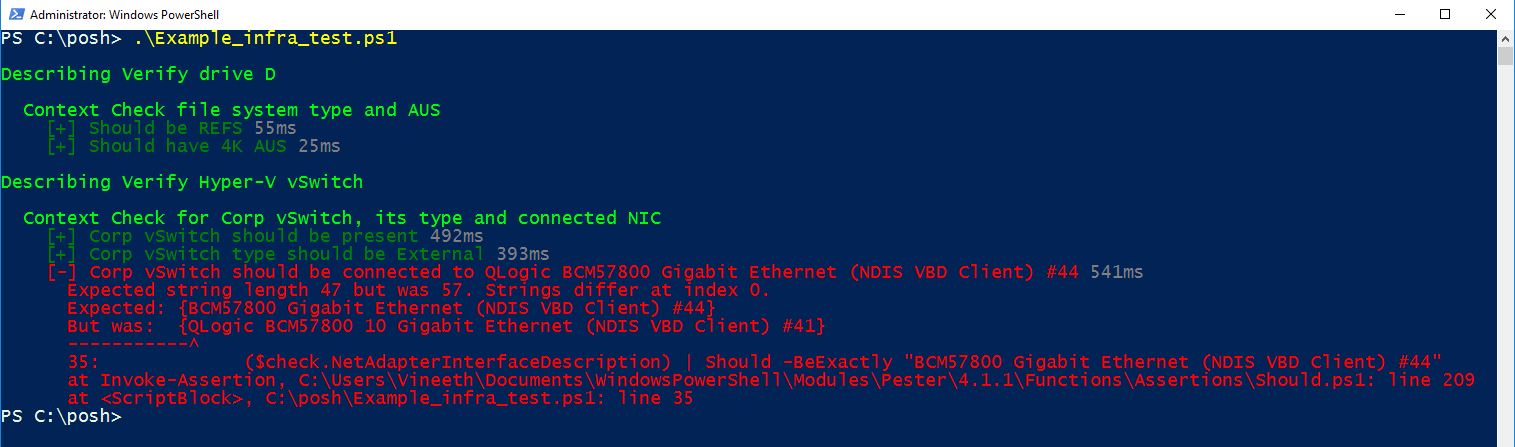
Output:
Here two tests passed and one failed.
The failed test shows the clear reason why it is failed.
Expected: {BCM57800 Gigabit Ethernet (NDIS VBD Client) #44}
But was: {QLogic BCM57800 10 Gigabit Ethernet (NDIS VBD Client) #41}
--------------------------------------------------------------------------------------------------
Now, if I combine the above two examples together (verify drive D and the vSwitch Corp) into a single test, the output will be:
You can also use:
Invoke-Pester -Script .\Example_infra_test.ps1 This will run all the test and will return you the number of tests passed, failed, skipped etc. as shown below.