In this post, I will explain how to configure the vCenter adapter and will also walk through some of the native dashboards.
Configuring vCenter adapter
- Login to vROps.
- Click the Administration tab.
- Select the vCenter Adapter.
- Click the gears icon.
- Provide necessary details.
- Click save settings and close.
- Once the above steps are done, in a few seconds you can see "Adapter Status" as Data receiving and "Collection State" as Collecting.
Note: After configuring the vCenter adapter you should actually wait for few days for all the data to get collected and populated.
Dashboards
This is the place where most of the System administrators/ Operations Engineers spend their time for understanding/ evaluating the operational aspects of their virtual infrastructure, capacity planning, troubleshooting various issues, performance optimizations, etc. vROps has many pre-canned dashboards that you get out-of-the-box. Below screenshot shows how to select/ navigate multiple dashboards that are available in vROps.
Now, I will just briefly explain some of my favorite dashboards.
Operations Overview
This dashboard provides data center summary. It provides info about the total number of clusters, hosts, total VMs, running VMs, datastores, etc. This dashboard also has widgets showing details about the top VMs experiencing CPU contention, memory contention, and disk latency.
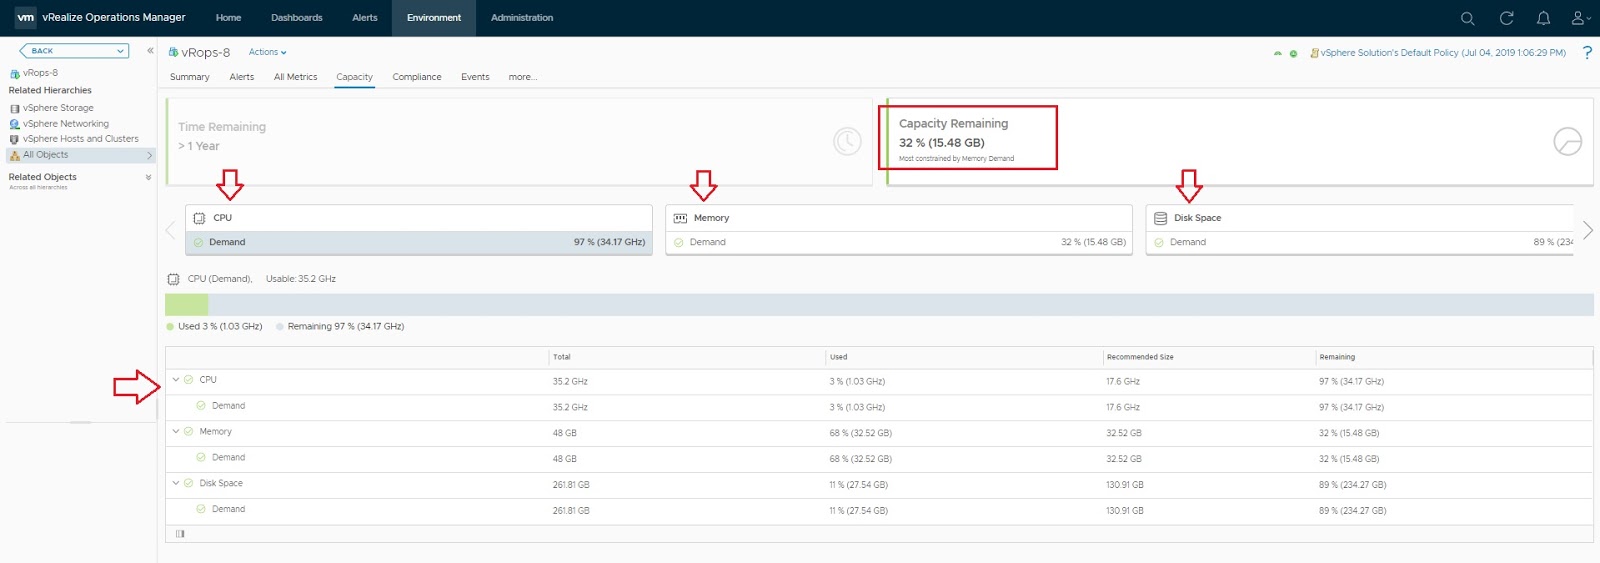
Utilization Overview
This dashboard provides a summary of the environment based on the selection. In this case, I selected a cluster. It shows the total (CPU/ memory/ storage) capacity of the selected environment, usable capacity, used capacity, remaining capacity, etc. This will be very useful for capacity planning of resources.
Cluster Utilization
This dashboard shows the CPU, memory, disk IOPS and network usage trends at the cluster level.
Datastore Utilization
This dashboard provides detailed info on datastore usage trends and heatmap based on datastore capacity/ utilization.
Heavy Hitter VMs
This dashboard provides cluster-level CPU, memory, IOPS and network throughput. It also gives a list of VMs which has generated the highest CPU demand, memory demand, highest IOPS and network throughput. This is very useful for identifying the VMs that has the highest resource consumption.
Hope it was useful. Cheers!