Showing posts with label performance. Show all posts

Saturday, April 18, 2020

vSAN performance benchmarking

In this article, I will explain briefly on performance benchmarking considerations, factors affecting performance, and some of the best practices. We do performance benchmarking to understand the capabilities and bottlenecks of a system. When I say system it could be a storage system, CPU, GPU, network switch, etc. Now let's consider a VMware vSAN cluster infrastructure. It includes multiple components and each of these contributes to the performance. In this case, the vSAN cluster is the solution under test. We will have to conduct performance benchmarking to understand the storage performance behavior of the cluster. When I say storage behavior it includes the IOPS, latency, and throughput that the cluster can produce under varying loads.

The goal of benchmarking
  • Identify bottlenecks
    • Hardware bottleneck
    • Software bottleneck
    • Application bottleneck
  • Compare tradeoffs
  • Manage expectations
  • Make decisions

Usually in a real-world scenario, benchmarking will be done once the cluster is deployed/ ready and before starting to host production workload on top of it. As these benchmark values define the performance maximums it will be helpful to decide on when to scale or upgrade the cluster before it hits a bottleneck.

Fundamental factors of vSAN performance

Server hardware
  • Compatibility as per vSAN HCL
Host
  • Number of hosts in the cluster
  • Power settings
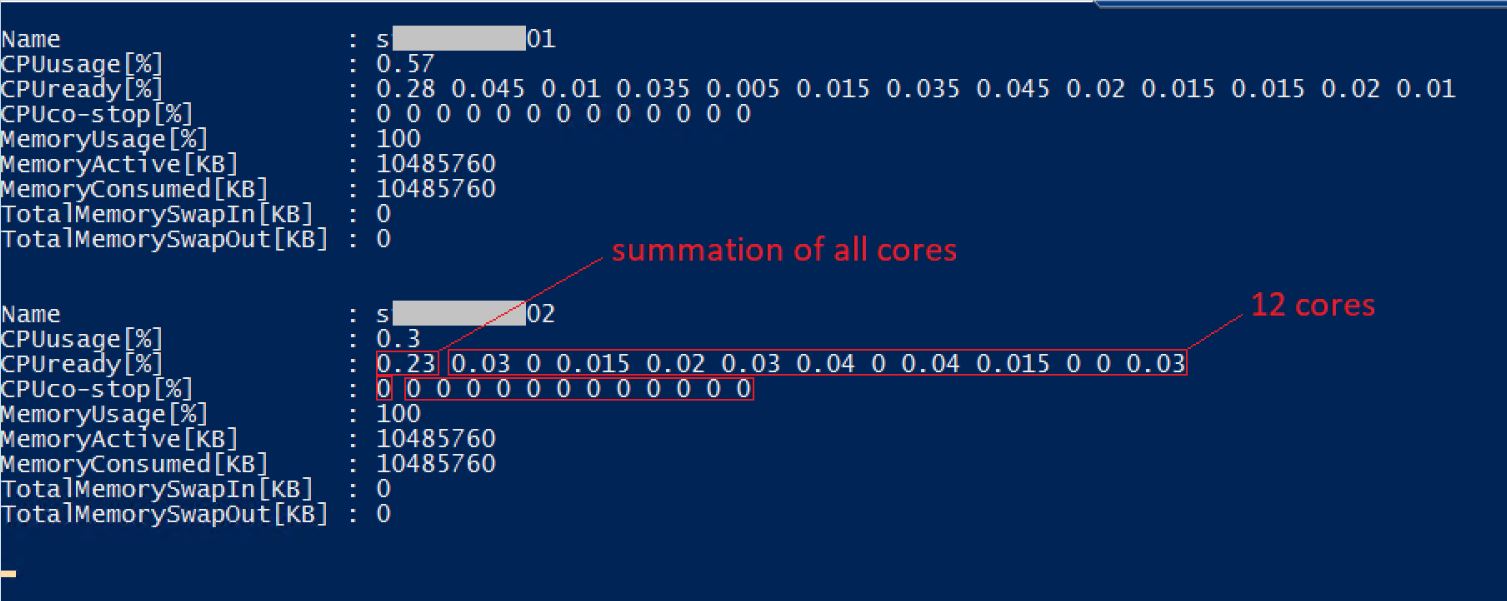
  • CPU - number of cores and frequency 
Storage
  • Hybrid or All-flash
  • NVMe, SAS, or SATA
  • Number of disk groups per host
  • Storage controller configuration
  • Compatibility of hardware devices as per vSAN HCL
Network
  • 10/ 25/ 40 GbE
  • MTU 
  • LAG
SPBM policy
  • FTT (Failures To Tolerate)
  • FTM (Mirroring/ Erasure coding)
  • Thin or Thick provision
Security
  • Encryption
  • Checksum
Other
  • Stripe width
  • Flash read cache reservation
  • IOPS limit for object
All of the above factors will affect performance. So you should know the benefits and tradeoffs. 

Benchmarking methodology

Image credit: VMware

Storage benchmarking tools

IO load generation tools
Application-specific tools
  • HammerDB (MSSQL, Oracle)
  • Jetstress (MS Exchange)
  • SLOB (Oracle)
  • DBGen (MSSQL, Oracle)

Best practices

  • Understand the production performance metrics.
  • Test what you plan to deploy.
  • Workload modeling.
  • Plan for use case testing.
  • Choose an appropriate size for benchmarking
  • Choose the right tool.
  • Pre-allocate blocks while testing.
  • Test for a longer time duration.
  • Deploy multiple VMs with multiple VMDKs.

References

Saturday, March 21, 2020

vRealize Operations Manager 8 - Custom views and reports

vROps has a number of inbuilt views and reports templates. In this post, I will explain how to create custom views and reports. 

To create a new view: Dashboards - Views - New view

Provide a name and description for the new view. Here, for example, I will create a view that shows datastore write performance stats.


Select List.


Select Datastore as subject and group it by cluster compute resource.


Drag and drop the selected metrics or properties to include in the view.
In the following screenshot, I selected a property "Is Local" and included in the view.


Added another property "Type" to the view.


Similarly, I added some metrics like Write IOPS, Latency and Throughout to the view.
I selected "Maximum" from transformation to get the peak value of the selected metrics.


In the below screenshot, you can see I selected "Maximum" and "Average" transformation for Write IOPS, Latency and Throughput metrics. You can also select the units as per your requirement. Here, I selected "us" for latency and "MBps" for throughput.

Click Save. 


Similarly, I created three custom views that show:
  • "Datastore read performance stats"
  • "Datastore write performance stats" 
  • "Datastore capacity usage"


To create a new report template: Dashboards - Reports - New template


Provide a name and description for the new report template.


From the views and dashboards, find the three custom datastore views that we created earlier, drag and drop them to the right pane as shown below.


Select PDF and CSV.


Select all the layout options if you like to and click Save.


Now the custom report template is created. You can select it and click Run.


Select vSpehre Hosts and Clusters and then select vSphere World and click ok.


The report will run in the background and will be available to download under the "Generated Reports" tab. You can select it and download the PDF or CSV file.


You can even configure a schedule to generate a report and email it or save it to a location automatically based on your requirements. Hope it was useful. Cheers!

Related posts


Monday, October 7, 2019

VMware PowerCLI 101 - Part5 - Real time storage IOPS and latency

It is very important to monitor and analyze the performance of storage subsystem components as it direcly affects the application performance. In this article, I will briefly explain how to use PowerCLI to get real time storage IOPS and latency of the following: 

              • Virtual disk
              • Datastore
              • Disk/ LUN 
              • Storage adapter
              • Storage path
Connect to vCenter server using:
Connect-VIServer <IP address of vCenter>

To understand the list of all available stats for a specific entity, you can use Get-StatType. For example, to list all real time stats for a virtual machine you can use:
Get-StatType -Entity <VM name> -Realtime | sort

Virtual disk

To get real-time IOPS and latency of all virtual disks of a VM named 'lustre01':
Get-Stat -Entity lustre01 -Realtime -MaxSamples 1 -Stat virtualDisk.numberReadAveraged.average,virtualDisk.numberWriteAveraged.average,virtualDisk.totalReadLatency.average,virtualDisk.totalWriteLatency.average | sort Instance,MetricId | select MetricId, Value, Unit, Instance


Datastore

To get real-time IOPS and latency of a datastore (with Uuid: 5bea72bb-5d72ed6a-1d85-246e96792988) from an ESXi host (IP: 192.168.105.10):
Get-Stat -Entity 192.168.105.10 -Stat datastore.numberReadAveraged.average,datastore.numberWriteAveraged.average,datastore.totalReadLatency.average,datastore.totalWriteLatency.average -Realtime -MaxSamples 1 -Instance 5bea72bb-5d72ed6a-1d85-246e96792988 | Select MetricId, Value, Unit, Instance | Sort-Object MetricId

Note: You can get Uuid of a datastore using (Get-Datastore vol01).ExtensionData.Info.Vmfs.Uuid


Refer my article "Real time VMware datastore performance monitoring using PowerShell" for monitoring the real time performance statistics of multiple shared VMFS datastores which are part of a multi-node VMware ESXi cluster.

Disk/ LUN

To get real-time IOPS and latency of a disk (eui.387de1af35b93f6ff0a9bef000000000): 
Get-Stat -Entity 192.168.105.10 -Disk -Realtime -Instance eui.387de1af35b93f6ff0a9bef000000000 -MaxSamples 1 -Stat disk.numberWriteAveraged.average,disk.numberReadAveraged.average,disk.totalWriteLatency.average,disk.totalReadLatency.average | Select MetricId, Value, Unit, Instance


Storage adapter

To get real-time IOPS and latency of a storage adapter: 
Get-Stat -Entity 192.168.105.10 -Realtime -MaxSamples 1 -Stat storageAdapter.totalReadLatency.average, storageAdapter.totalWriteLatency.average, storageAdapter.numberReadAveraged.average, storageAdapter.numberWriteAveraged.average -Instance vmhba64 | Select-Object MetricId, Value, Unit, Instance | Sort-Object MetricId


Storage Path

To get real-time IOPS and latency of a storage path:
Get-Stat -Entity 192.168.105.10 -Realtime -MaxSamples 1 -Stat storagePath.totalReadLatency.average, storagePath.totalWriteLatency.average, storagePath.numberReadAveraged.average, storagePath.numberWriteAveraged.average -Instance fc.300fb123ba76519c:b436362bae5b217-fc.300fb123ba76519c:b436362bae5b217-eui.387de1af35b93f6ff0a9beec00000001 | Select MetricId,Value,Unit,Instance | Sort-Object MetricId


Saturday, November 17, 2018

Real time VMware VM resource monitoring using PowerShell

This post is about monitoring resource usage of a list of virtual machines hosted on VMware ESXi clusters using PowerCLI. Output format is given below which gets refreshed automatically every few seconds.

Prerequisites:
  • VMware.PowerCLI module should be installed on the node from which you are running the script
  • You can verify using: Get-Module -Name VMware.PowerCLI -ListAvailable
  • If not installed, you can find the latest version from the PSGallery: Find-Module -Name VMware.PowerCLI
  • Install the module: Install-Module -Name VMware.PowerCLI
Note:
  • I am using PowerCLI Version 11.0.0.10380590

Latest version of the project and code available at: github.com/vineethac/vmware_vm_monitor

    Sample screenshot of output:


    Notes:

    VMware guidance: CPU Ready time and Co-Stop values per core greater than 5% and 3% respectively could  be a performance concern.

    Hope this will be useful for resource monitoring as well as right sizing of VMs. Cheers!

    References:

    Saturday, October 20, 2018

    Real time VMware datastore performance monitoring using PowerShell

    I had a scenario where we had to monitor the real time performance statistics of multiple shared VMFS datastores which are part of a multi-node VMware ESXi cluster. So this post is about the short script which uses VMware PowerCLI to get read/ write IOPS and latency details of these shared datastores across all nodes in the cluster. The output format is given below which gets refreshed automatically every few seconds.

    Prerequisites:
    • VMware.PowerCLI module should be installed on the node from which you are running the script
    • You can verify using: Get-Module -Name VMware.PowerCLI -ListAvailable
    • If not installed, you can find the latest version from the PSGallery: Find-Module -Name VMware.PowerCLI
    • Install the module: Install-Module -Name VMware.PowerCLI
    Note:
    • I am using PowerCLI Version 11.0.0.10380590


    Latest version of the project and code available at: github.com/vineethac/datastore_perfmon

    Sample screenshot of output:


    Hope it was useful. Cheers!

    Reference:

    Saturday, November 28, 2015

    Recommended BIOS settings for DELL PowerEdge 12G servers

    BIOS settings for optimal performance

    Memory mode : Optimizer
    Node interleave : Disabled
    Logical processor : Enabled
    QPI frequency : Maximum frequency
    CPU power management : Maximum performance
    Turbo boost : Enabled
    C1E : Disabled
    C-states : Disabled
    Memory frequency : Maximum performance