Thursday, August 1, 2024

A decade of tech - My professional journey so far

Laying the Groundwork

My professional career commenced in February 2014, as a Trainee IT Services Engineer at Alamy Images. During my initial days, I was tasked with daily maintenance activities such as running tape backups, setting up Active Directory user accounts, mailboxes, and desktops for new employees. I also handled general IT support, troubleshooting various user issues within the organization.

After a few months, I had the opportunity to set up a lab infrastructure project using old decommissioned servers as part of a continuous learning initiative. This hands-on experience involved racking, stacking, and cabling physical servers, installing and configuring ESXi and Hyper-V hypervisors, FreeNAS storage servers, and deploying highly available clusters. Additionally, I gained exposure to configuring L2 network switches. This project significantly contributed to building my IT infrastructure foundation.

A year later, I was promoted to Junior IT Services Engineer, where I focused on virtualization projects. I spearheaded the migration of over 20 Dev/ Test/ UAT virtual machines from VMware to a Hyper-V cluster, enhancing system flexibility and cost-efficiency. I deployed a high-availability Hyper-V failover cluster in production and contributed to the planning and execution of a iSCSI storage server migration project.

Beyond virtualization, I worked on network infrastructure by a seamless L2 switch replacement and upgrade project with minimal operational disruption. Furthermore, I assisted in capacity planning initiatives for optimized resource utilization for both physical and virtual environments. These experiences refined my technical skills and problem-solving abilities. During this time, I developed a passion for infrastructure management and optimization, shaping my future career path.

From Junior IT Services Engineer to Storage Solutions Engineer

In January 2017, I transitioned to a Systems Development Engineer role at Dell EMC, specializing in Solutions Engineering. This marked a significant career shift as I immersed myself in the world of storage and virtualization solutions integration/development.

My daily responsibilities encompassed the installation and testing of various components, progressing from integration to validating system reliability and performance at scale. I designed and deployed multiple PowerFlex software-defined storage clusters for customer demos and proof-of-concepts, showcasing the product's performance and auto rebuild capabilities. A notable achievement was automating the storage performance benchmarking using PowerShell, FIO, and ELK stack, reducing process time from weeks to days.

I led the engineering efforts for developing a vROps management pack for PowerFlex, ensuring seamless integration and visibility. Additionally, I mastered vSphere Virtual Volumes (vVols), successfully executing integration projects between Dell storage solutions and VMware environments.

To streamline operations, I created a PowerShell module for managing PowerFlex using REST APIs and developed Ansible playbook for automated deployment of Kubernetes cluster with PowerFlex CSI driver. My expertise extended beyond systems engineering and automation as I authored and published whitepapers on disaster recovery using VMware SRM and hardware lifecycle management with Dell OME.

This period solidified my reputation as a virtualization and storage solutions expert, providing me with a deep understanding of storage architecture, performance optimization, and automation. I developed a passion for building scalable and reliable hyperconverged solutions.

From Storage Solutions Engineer to Site Reliability Engineer

In July 2021, I transitioned to a Site Reliability Engineer (SRE) role at VMware, focusing on ensuring the reliability and scalability of Kubernetes-as-a-Service project based on the vSphere with Tanzu platform.


Managing a vast infrastructure of Kubernetes clusters, I honed my skills in incident response, GitOps pipelines, automation, and monitoring. I played a crucial role in maintaining platform availability, collaborating closely with multiple internal teams and stakeholders to resolve issues and enhance service delivery. My proficiency in Python and PowerShell was instrumental in automating tasks and building custom monitoring solutions. During this time, I prepared diligently, practiced extensively, and successfully qualified for the CKA exam.

Beyond core SRE responsibilities, I explored emerging technologies. I successfully deployed and evaluated open-source language models on Kubernetes using Python, Ollama, and LangChain. In addition, I contributed to developing custom metrics for the Kubernetes-as-a-Service platform using Python, Prometheus, Grafana, and Helm.

This role deepened my expertise and ability to bridge the gap between development and operations, fostering a culture of reliability and efficiency. It has been an exciting journey of learning and growth, positioning me as a versatile IT professional with a strong foundation in both infrastructure and cloud-native technologies.

Gratitude

"This journey has been immensely fulfilling, made possible by the support and encouragement of exceptional organisations, inspiring managers, talented colleagues, friends, and family. I am truly grateful for the opportunities to learn, grow, and contribute meaningfully to driving success and making a positive impact."

The journey continues...

Thursday, July 4, 2024

vSphere with Tanzu using NSX-T - Part35 - Monitoring supervisor cluster health with Python and vCenter APIs

vSphere with Tanzu Supervisor cluster is a Kubernetes platform that simplifies the deployment, management, and scaling of Kubernetes clusters. Monitoring the health of your WCP/ Supervisor clusters is crucial to ensure the smooth running of your Tanzu Kubernetes Clusters (TKCs) and applications. In this blog post, we'll explore how to use Python and vCenter APIs to verify the health of your Supervisor clusters.

You can access the Python script from my GitHub repository: https://github.com/vineethac/VMware/tree/main/vSphere_with_Tanzu/wcp_cluster_health


This script connects to the vCenter server, retrieves the cluster summary, and checks the Tanzu Supervisor cluster configuration info and prints the status of the cluster. By using this Python script, you can easily monitor the health of your Tanzu Supervisor clusters through vCenter APIs.

Hope it was useful. Cheers!

Monday, July 1, 2024

vSphere with Tanzu using NSX-T - Part34 - CPU and Memory utilization of a supervisor cluster

vSphere with Tanzu is a Kubernetes-based platform for deploying and managing containerized applications. As with any cloud-native platform, it's essential to monitor the performance and utilization of the underlying infrastructure to ensure optimal resource allocation and avoid any potential issues. In this blog post, we'll explore a Python script that can be used to check the CPU and memory allocation/ usage of a WCP Supervisor cluster.


You can access the Python script from my GitHub repository: https://github.com/vineethac/VMware/tree/main/vSphere_with_Tanzu/wcp_cluster_util


Sample screenshot of the output


The script uses the Kubernetes Python client library (kubernetes) to connect to the Supervisor cluster using the admin kubeconfig and retrieve information about the nodes and their resource utilization. The script then calculates the average CPU and memory utilization across all nodes and prints the results to the console.

Note: In my case instead of running it as a script every time, I made it an executable plugin and copied it to the system executable path. I placed it in $HOME/.krew/bin in my laptop.

Hope it was useful. Cheers!

Wednesday, June 26, 2024

vSphere with Tanzu using NSX-T - Part33 - Troubleshooting intermittent connection timeouts to apiserver and workloads

In the realm of managing Tanzu Kubernetes clusters (TKCs), we have encountered several challenges that hindered the smooth functioning of our applications. In this blog post, we will discuss three such cases and the workarounds we employed to resolve them.


Case 1: TKC Control Plane Node Connectivity Issues


Symptoms:
  • TKC apiserver connection timeouts when attempting to connect using the kubeconfig.
  • Traffic was not flowing to two of the control plane nodes.
  • NSX-T web UI LB VS stats indicated this issue.


Case 2: TKC Worker Node Connectivity Issues


Symptoms:
  • Workload (example: PostgreSQL cluster) connection timeouts.
  • Traffic was not flowing to two of the worker nodes in the TKC.
  • NSX-T web UI LB VS stats indicated this issue.


Case 3: Load Balancer Connectivity Issues


Symptoms:
  • Connection timeouts when attempting to connect to a PostgreSQL workload through the load balancer VS IP.
  • This issue was observed only when creating new services of type LoadBalancer in the TKC.
  • We noticed datapath mempool usage for the edge nodes was above the threshold value.


Resolution/ work around

  • Find the T1 router that is attached to the TKC which has connectivity issues. 
  • In an Active - Standby HA configuration, you will see that there will be one Edge node that will be Active and another one in Standby status. 
  • First place the Standby Edge node in NSX MM, reboot it, and then exit it from NSX MM. 
  • Now, place the Active Edge node in NSX MM, there will be a slight network disruption during this failover, once it is in NSX MM, reboot it, and then exit NSX MM. 
  • This should resolved the issue.


In conclusion, these cases illustrate the importance of verifying NSX-T components when managing Tanzu Kubernetes clusters. By identifying the root cause of the issues and employing effective workarounds, we were able to restore functionality and maintain the health of our applications. Stay tuned for more insights and best practices in managing Kubernetes clusters.

Hope it was useful. Cheers!

vSphere with Tanzu using NSX-T - Part32 - Troubleshooting BGP related issues

This article provides basic guidance on troubleshooting BGP related issues.

Sample diagram showing connectivity between Edge Nodes and TOR switches

Verify Tier-0 Gateway status on NSX-T

  • Status of T0 should be Success.


  • Check the interfaces of T0 to identify which all edge nodes are part of it.


  • Check the status of Edge Transport Nodes.


  • As you can see from the T0 interfaces, Edge01/02/03/04 are part of it and in those edge nodes you should be able to see the SR_TIER0 component. Next step is to login to those Edge nodes that are part of T0 and verify BGP summary.

Verify BGP on all Edge nodes that are part of T0 Gateway  

  • SSH into the edge node as admin user.
  • get logical-router
  • Look for SERVICE_ROUTER_TIER0.
sc2-01-nsxt04-r08edge02> get logical-router
Logical Router
UUID                                   VRF    LR-ID  Name                              Type                        Ports   Neighbors
736a80e3-23f6-5a2d-81d6-bbefb2786666   0      0                                        TUNNEL                      4       22/5000
e6d02207-c51e-4cf8-81a6-44afec5ad277   2      84653  DR-t1-domain-c1034:1de3adfa-0ee   DISTRIBUTED_ROUTER_TIER1    5       9/50000
a590f1da-2d79-4749-8153-7b174d23b069   32     85271  DR-t1-domain-c1034:1de3adfa-0ee   DISTRIBUTED_ROUTER_TIER1    5       5/50000
758d9736-6781-4b3a-906f-3d1b03f0924d   33     88016  DR-t1-domain-c1034:1de3adfa-0ee   DISTRIBUTED_ROUTER_TIER1    4       1/50000
5e7bfe98-0b5e-4620-90b1-204634e99127   37     3      SR-sc2-01-nsxt04-tr               SERVICE_ROUTER_TIER0        6       5/50000
  • vrf <SERVICE_ROUTER_TIER0 VRF>
  • get bgp neighbor summary
  • Note: If everything is working fine State should show Estab.
sc2-01-nsxt04-r08edge02> vrf 37
sc2-01-nsxt04-r08edge02(tier0_sr[37])> get bgp neighbor summary
BFD States: NC - Not configured, DC - Disconnected
            AD - Admin down, DW - Down, IN - Init, UP - Up
BGP summary information for VRF default for address-family: ipv4Unicast
Router ID: 10.184.248.2  Local AS: 4259971071

Neighbor                            AS          State Up/DownTime  BFD InMsgs  OutMsgs InPfx  OutPfx

10.184.248.239                      4259970544  Estab 05w1d22h     NC  12641393 12610093 2      568
10.184.248.240                      4259970544  Estab 05w1d23h     NC  12640337 11580431 2      566

  • You should be able to ping to the BGP neighbor IP. If you are unable to ping to neighbor IPs, then there is an issue.
sc2-01-nsxt04-r08edge02(tier0_sr[37])> ping 10.184.248.239
PING 10.184.248.239 (10.184.248.239): 56 data bytes
64 bytes from 10.184.248.239: icmp_seq=0 ttl=255 time=1.788 ms
^C
--- 10.184.248.239 ping statistics ---
2 packets transmitted, 1 packets received, 50.0% packet loss
round-trip min/avg/max/stddev = 1.788/1.788/1.788/0.000 ms

sc2-01-nsxt04-r08edge02(tier0_sr[37])> ping 10.184.248.240
PING 10.184.248.240 (10.184.248.240): 56 data bytes
64 bytes from 10.184.248.240: icmp_seq=0 ttl=255 time=1.925 ms
64 bytes from 10.184.248.240: icmp_seq=1 ttl=255 time=1.251 ms
^C
--- 10.184.248.240 ping statistics ---
3 packets transmitted, 2 packets received, 33.3% packet loss
round-trip min/avg/max/stddev = 1.251/1.588/1.925/0.337 ms

  • Get interfaces | more
sc2-01-nsxt04-r08edge02> vrf 37
sc2-01-nsxt04-r08edge02(tier0_sr[37])> get interfaces | more
Fri Aug 19 2022 UTC 11:07:18.042
Logical Router
UUID                                   VRF    LR-ID  Name                              Type
5e7bfe98-0b5e-4620-90b1-204634e99127   37     3      SR-sc2-01-nsxt04-tr               SERVICE_ROUTER_TIER0
Interfaces (IPv6 DAD Status A-DAD_Success, F-DAD_Duplicate, T-DAD_Tentative, U-DAD_Unavailable)
    Interface     : dd83554d-47c0-5a4e-9fbe-3abb1239a071
    Ifuid         : 335
    Mode          : cpu
    Port-type     : cpu
    Enable-mcast  : false

    Interface     : 008b2b15-17d1-4cc8-9d94-d9c4c2d0eb3a
    Ifuid         : 1000
    Name          : tr-interconnect-edge02
    Fwd-mode      : IPV4_AND_IPV6
    Internal name : uplink-1000
    Mode          : lif
    Port-type     : uplink
    IP/Mask       : 10.184.248.2/24
    MAC           : 02:00:70:51:9d:79
    VLAN          : 1611


Verify BGP on Cisco TOR switches

  • SSH to TOR switch.
  • show ip bgp summary
❯ ssh -o PubkeyAuthentication=no netadmin@sc2-01-r08lswa.xxxxxxxx.com
User Access Verification
(netadmin@sc2-01-r08lswa.xxxxxxxx.com) Password:

Cisco Nexus Operating System (NX-OS) Software

sc2-01-r08lswa# show ip bgp summary
BGP summary information for VRF default, address family IPv4 Unicast
BGP router identifier 10.184.17.248, local AS number 65001.65008
BGP table version is 520374, IPv4 Unicast config peers 10, capable peers 8
5150 network entries and 11372 paths using 2003240 bytes of memory
BGP attribute entries [110/18920], BGP AS path entries [69/1430]
BGP community entries [0/0], BGP clusterlist entries [0/0]
11356 received paths for inbound soft reconfiguration
11356 identical, 0 modified, 0 filtered received paths using 0 bytes

Neighbor        V    AS MsgRcvd MsgSent   TblVer  InQ OutQ Up/Down  State/PfxRcd
10.184.10.14    4 65011.65000
                        47979514 10570342   520374    0    0     5w1d 4541
10.184.10.78    4 65011.65000
                        47814555 10601750   520374    0    0     5w1d 4541
10.184.248.1    4 65001.65535
                          80831   79447   520374    0    0 02:41:51 566
10.184.248.2    4 65001.65535
                        3215614 3269391   520374    0    0     5w1d 566
10.184.248.3    4 65001.65535
                        3215776 3269344   520374    0    0     1w3d 566
10.184.248.4    4 65001.65535
                        3215676 3269383   520374    0    0 13:51:45 566
10.184.248.5    4 65001.65535
                        3200531 3269384   520374    0    0     5w1d 5
10.184.248.6    4 65001.65535
                        3197752 3266700   520374    0    0     5w1d 5


  • show ip arp
sc2-01-r08lswa# show ip arp 10.184.248.2

Flags: * - Adjacencies learnt on non-active FHRP router
       + - Adjacencies synced via CFSoE
       # - Adjacencies Throttled for Glean
       CP - Added via L2RIB, Control plane Adjacencies
       PS - Added via L2RIB, Peer Sync
       RO - Re-Originated Peer Sync Entry
       D - Static Adjacencies attached to down interface

IP ARP Table
Total number of entries: 1
Address         Age       MAC Address     Interface       Flags
10.184.248.2    00:06:12  0200.7051.9d79  Vlan1611


  • If you compare this IP and MAC, you can see that its the same of your T0 SR uplink of your edge02 node.
IP/Mask       : 10.184.248.2/24
MAC           : 02:00:70:51:9d:79

For further troubleshooting you can do packet capture from the edge nodes and ESXi server and analyze them using Wireshark.

Packet capture from Edge node

  • Capture packets from the T0 SR uplink interface.
sc2-01-nsxt04-r08edge01(tier0_sr[5])> get interfaces | more
Wed Aug 17 2022 UTC 13:52:48.203
Logical Router
UUID                                   VRF    LR-ID  Name                              Type
fb1ad846-8757-4fdf-9cbb-5c22ba772b52   5      2      SR-sc2-01-nsxt04-tr               SERVICE_ROUTER_TIER0
Interfaces (IPv6 DAD Status A-DAD_Success, F-DAD_Duplicate, T-DAD_Tentative, U-DAD_Unavailable)
    Interface     : c8b80ba1-93fc-5c82-a44f-4f4863b6413c
    Ifuid         : 286
    Mode          : cpu
    Port-type     : cpu
    Enable-mcast  : false

    Interface     : 4915d978-9c9a-58bc-84e2-cafe5442cba4
    Ifuid         : 287
    Mode          : blackhole
    Port-type     : blackhole

    Interface     : 899bcf30-83e2-46bb-9be2-8889ec52b354
    Ifuid         : 833
    Name          : tr-interconnect-edge01
    Fwd-mode      : IPV4_AND_IPV6
    Internal name : uplink-833
    Mode          : lif
    Port-type     : uplink
    IP/Mask       : 10.184.248.1/24
    MAC           : 02:00:70:d1:92:b1
    VLAN          : 1611
    Access-VLAN   : untagged
    LS port       : 15b971e9-7caa-43b7-86c1-96ff50453402
    Urpf-mode     : STRICT_MODE
    DAD-mode      : LOOSE
    RA-mode       : SLAAC_DNS_TRHOUGH_RA(M=0, O=0)
    Admin         : up
    Op_state      : up
    Enable-mcast  : False
    MTU           : 9000
    arp_proxy     :


  • Start a continuous ping from the TOR switches to the edge uplink IP (in this case ping 10.184.248.1 from TOR switches) before starting packet capture.
sc2-01-nsxt04-r08edge01> start capture interface 899bcf30-83e2-46bb-9be2-8889ec52b354 file uplink.pcap


Note:
Find the location of uplink.pcap file on TOR switches and SCP it locally to analyze using Wireshark.


Packet capture from ESXi

  • In this example, we are capturing packets of sc2-01-nsxt04-r08edge01 VM from the switchports where its interfaces are connected. sc2-01-nsxt04-r08edge01 VM is running on ESXi node sc2-01-r08esx10.
[root@sc2-01-r08esx10:~] esxcli network vm list | grep edge
18790721  sc2-01-nsxt04-r08edge05                                                 3  , ,
18977245  sc2-01-nsxt04-r08edge01                                                 3  , ,

[root@sc2-01-r08esx10:/tmp] esxcli network vm port list -w 18977245
   Port ID: 67109446
   vSwitch: sc2-01-vc16-dvs
   Portgroup:
   DVPort ID: b60a80c0-ecd6-40bd-8d2b-fbd1f06bb172
   MAC Address: 02:00:70:33:a9:67
   IP Address: 0.0.0.0
   Team Uplink: vmnic1
   Uplink Port ID: 2214592517
   Active Filters:

   Port ID: 67109447
   vSwitch: sc2-01-vc16-dvs
   Portgroup:
   DVPort ID: 6e3d8057-fc23-4180-b0ba-bed90381f0bf
   MAC Address: 02:00:70:d1:92:b1
   IP Address: 0.0.0.0
   Team Uplink: vmnic1
   Uplink Port ID: 2214592517
   Active Filters:

   Port ID: 67109448
   vSwitch: sc2-01-vc16-dvs
   Portgroup:
   DVPort ID: c531df19-294d-4079-b39c-89a3b58e30ad
   MAC Address: 02:00:70:30:c7:01
   IP Address: 0.0.0.0
   Team Uplink: vmnic0
   Uplink Port ID: 2214592519
   Active Filters:


  • Start a continuous ping from the TOR switches to the edge uplink IP (in this case ping 10.184.248.1 from TOR switches) before starting packet capture.
[root@sc2-01-r08esx10:/tmp] pktcap-uw --switchport 67109446 --dir 2 -o /tmp/67109446-02:00:70:33:a9:67.pcap --count 1000 & pktcap-uw --switchport 67109447 --dir 2 -o /tmp/67109447-02:00:70:d1:92:b1.pcap --count 1000 & pktcap-uw --switchport 67109448 --dir 2 -o /tmp/67109448-02:00:70:30:c7:01.pcap --count 1000


Note:
SCP the pcap files to laptop and use Wireshark to analyse them.
You can also do packet capture from physical uplinks (vmnic) of the ESXi node if required.

Hope it was useful. Cheers!

Saturday, June 22, 2024

vSphere with Tanzu using NSX-T - Part31 - Troubleshooting inaccessible TKC with expired control plane certs

In the course of managing multiple Tanzu Kubernetes Clusters (TKC), I encountered an unexpected issue: the control plane certificates had expired, preventing us from accessing the cluster using the kubeconfig file. To make matters worse, we were unable to SSH into the TKC control plane Virtual Machines (VMs) due to the vmware-system-user password expiring in accordance with STIG Hardening.

The recommended workaround for updating the vmware-system-user password expiry involves applying a specific daemonset on Guest Clusters. However, this approach requires access to the TKC using its admin kubeconfig file, which was unavailable due to the expired certificates.

Warning: In case of critical production issues that affect the accessibility of your Tanzu Kubernetes Cluster (TKC), it is strongly advised to submit a product support request to our team for assistance. This will ensure that you receive expert guidance and a timely resolution to help minimize the impact on your environment.

To resolve this issue, I followed an alternative workaround: I reset the root password of the TKC control plane VMs through the vCenter VM console, as outlined in this knowledge base article. Once the root password was reset, I was able to log directly into the TKC control plane VM using the VM console.


After gaining access to the TKC control plane VM, I proceeded to renew the control plane certificates using kubeadm, as detailed in this blog post. It's essential to apply this process to all control plane nodes in your cluster to ensure proper functionality.

root [ /etc/kubernetes ]# kubeadm certs check-expiration

root [ /etc/kubernetes ]# kubeadm certs renew all
[renew] Reading configuration from the cluster...
[renew] FYI: You can look at this config file with 'kubectl -n kube-system get cm kubeadm-config -o yaml'
[renew] Error reading configuration from the Cluster. Falling back to default configuration

certificate embedded in the kubeconfig file for the admin to use and for kubeadm itself renewed
certificate for serving the Kubernetes API renewed
certificate the apiserver uses to access etcd renewed
certificate for the API server to connect to kubelet renewed
certificate embedded in the kubeconfig file for the controller manager to use renewed
certificate for liveness probes to healthcheck etcd renewed
certificate for etcd nodes to communicate with each other renewed
certificate for serving etcd renewed
certificate for the front proxy client renewed
certificate embedded in the kubeconfig file for the scheduler manager to use renewed

Done renewing certificates. You must restart the kube-apiserver, kube-controller-manager, kube-scheduler and etcd, so that they can use the new certificates.

Although this workaround required some additional steps, it ultimately allowed us to regain access to our Tanzu Kubernetes Cluster and maintain its security and functionality.

Hope it was useful. Cheers!

Saturday, May 25, 2024

vSphere with Tanzu using NSX-T - Part30 - Troubleshooting inaccessible TKC with server pool members missing in the LB VS

Encountering issues with connectivity to your TKC apiserver/ control plane can be frustrating. One common problem we've seen is the kubeconfig failing to connect, often due to missing server pool members in the load balancer's virtual server (LB VS).

The Issue

The LB VS, which operates on port 6443, should have the control plane VMs listed as its member servers. When these members are missing, connectivity problems arise, disrupting your access to the TKC apiserver.

Troubleshooting steps

  1. Access the TKC: Use the kubeconfig to access the TKC.
    ❯ KUBECONFIG=tkc.kubeconfig kubectl get node
    Unable to connect to the server: dial tcp 10.191.88.4:6443: i/o timeout
    
    
  2. Check the Load Balancer: In NSX-T, verify the status of the corresponding load balancer (LB). It may display a green status indicating success.
  3. Inspect Virtual Servers: Check the virtual servers in the LB, particularly on port 6443. They might show as down.
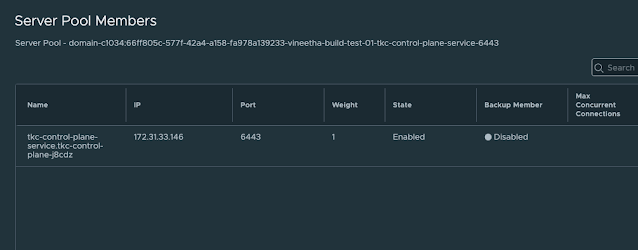
  4. Examine Server Pool Members: Look into the server pool members of the virtual server. You may find it empty.
  5. SSH to Control Plane Nodes: Attempt to SSH into the TKC control plane nodes.
  6. Run Diagnostic Commands: Execute diagnostic commands inside the control plane nodes to verify their status. The issue could be that the control plane VMs are in a hung state, and the container runtime is not running.
    vmware-system-user@tkc-infra-r68zc-jmq4j [ ~ ]$ sudo su
    root [ /home/vmware-system-user ]# crictl ps
    FATA[0002] failed to connect: failed to connect, make sure you are running as root and the runtime has been started: context deadline exceeded
    root [ /home/vmware-system-user ]#
    root [ /home/vmware-system-user ]# systemctl is-active containerd
    Failed to retrieve unit state: Failed to activate service 'org.freedesktop.systemd1': timed out (service_start_timeout=25000ms)
    root [ /home/vmware-system-user ]#
    root [ /home/vmware-system-user ]# systemctl status containerd
    WARNING: terminal is not fully functional
    -  (press RETURN)Failed to get properties: Failed to activate service 'org.freedesktop.systemd1'>
    lines 1-1/1 (END)lines 1-1/1 (END)
    
  7. Check VM Console: From vCenter, check the console of the control plane VMs. You might see specific errors indicating issues.
    EXT4-fs (sda3): Delayed block allocation failed for inode 266704 at logical offset 10515 with max blocks 2 with error 5
    EXT4-fs (sda3): This should not happen!! Data will be lost
    EXT4-fs error (device sda3) in ext4_writepages:2905: IO failure
    EXT4-fs error (device sda3) in ext4_reserve_inode_write:5947: Journal has aborted
    EXT4-fs error (device sda3) xxxxxx-xxx-xxxx: unable to read itable block
    EXT4-fs error (device sda3) in ext4_journal_check_start:61: Detected aborted journal
    systemd[1]: Caught <BUS>, dumped core as pid 24777.
    systemd[1]: Freezing execution.
    
  8. Restart Control Plane VMs: Restart the control plane VMs. Note that sometimes your admin credentials or administrator@vsphere.local credentials may not allow you to restart the TKC VMs. In such cases, decode the username and password from the relevant secret and use these credentials to connect to vCenter and restart the hung TKC VMs.
    ❯ kubectx wdc-01-vc17
    Switched to context "wdc-01-vc17".
    
    ❯ kg secret -A | grep wcp
    kube-system                                 wcp-authproxy-client-secret                                               kubernetes.io/tls                                  3      291d
    kube-system                                 wcp-authproxy-root-ca-secret                                              kubernetes.io/tls                                  3      291d
    kube-system                                 wcp-cluster-credentials                                                   Opaque                                             2      291d
    vmware-system-nsop                          wcp-nsop-sa-vc-auth                                                       Opaque                                             2      291d
    vmware-system-nsx                           wcp-cluster-credentials                                                   Opaque                                             2      291d
    vmware-system-vmop                          wcp-vmop-sa-vc-auth                                                       Opaque                                             2      291d
    
    ❯ kg secrets -n vmware-system-vmop wcp-vmop-sa-vc-auth
    NAME                  TYPE     DATA   AGE
    wcp-vmop-sa-vc-auth   Opaque   2      291d
    ❯ kg secrets -n vmware-system-vmop wcp-vmop-sa-vc-auth -oyaml
    apiVersion: v1
    data:
      password: aWAmbHUwPCpKe1Uxxxxxxxxxxxx=
      username: d2NwLXZtb3AtdXNlci1kb21haW4tYzEwMDYtMxxxxxxxxxxxxxxxxxxxxxxxxQHZzcGhlcmUubG9jYWw=
    kind: Secret
    metadata:
      creationTimestamp: "2022-10-24T08:32:26Z"
      name: wcp-vmop-sa-vc-auth
      namespace: vmware-system-vmop
      resourceVersion: "336557268"
      uid: dcbdac1b-18bb-438c-ba11-76ed4d6bef63
    type: Opaque
    
    
    ***Decrypt the username and password from the secret and use it to connect to the vCenter.
    ***Following is an example using PowerCLI:
    
    PS /Users/vineetha> get-vm gc-control-plane-f266h
    
    Name                 PowerState Num CPUs MemoryGB
    ----                 ---------- -------- --------
    gc-control-plane-f2… PoweredOn  2        4.000
    
    PS /Users/vineetha> get-vm gc-control-plane-f266h | Restart-VMGuest
    Restart-VMGuest: 08/04/2023 22:20:20	Restart-VMGuest		Operation "Restart VM guest" failed for VM "gc-control-plane-f266h" for the following reason: A general system error occurred: Invalid fault
    PS /Users/vineetha>
    PS /Users/vineetha> get-vm gc-control-plane-f266h | Restart-VM
    
    Confirm
    Are you sure you want to perform this action?
    Performing the operation "Restart-VM" on target "VM 'gc-control-plane-f266h'".
    [Y] Yes  [A] Yes to All  [N] No  [L] No to All  [S] Suspend  [?] Help (default is "Y"): Y
    
    Name                 PowerState Num CPUs MemoryGB
    ----                 ---------- -------- --------
    gc-control-plane-f2… PoweredOn  2        4.000
    
    PS /Users/vineetha>
    
  9. Verify System Pods and Connectivity: Once the control plane VMs are restarted, the system pods inside them will start, and the apiserver will become accessible using the kubeconfig. You should also see the previously missing server pool members reappear in the corresponding LB virtual server, and the virtual server on port 6443 will be up and show a success status.

Following these steps should help you resolve the connectivity issues with your TKC apiserver/control plane effectively.Ensuring that your load balancer's virtual server is correctly configured with the appropriate member servers is crucial for maintaining seamless access. This runbook aims to guide you through the process, helping you get your TKC apiserver back online swiftly.

Note: If required for critical production issues related to TKC accessibility I strongly recommend to raise a product support request.

Hope it was useful. Cheers!