Wednesday, October 23, 2019

Docker 101 - Part4 - Creating images using dockerfile

In this article, I will briefly explain how to create your own image using Dockerfile. For example, I will be creating an FIO image. FIO is a storage stress test tool and this image can be used for container storage IO benchmarking/ testing.

  • Login to the CentOS docker host.
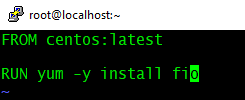
  • Create a file named "Dockerfile".
  • # vi Dockerfile
  • Add the below two lines and save it.

  • # docker build ./

  • Once the build is complete, it returns the IMAGE ID as shown below.
  • You can use the "docker tag" command to mention a repository and tag to the image. 

  • At this stage, as shown in the above screenshot, the FIO image is created with repository "vineethac/fio_image" and tagged as "latest".
  • You can run this image as given below.

  • # docker run -dit --name FIO_test01 --mount source=disk_data,target=/vol vineethac/fio_image fio --name=RandomReadTest1 --readwrite=randread --rwmixwrite=0 --bs=4k --invalidate=1 --direct=1 --filename=/vol/newfile --size=10g --time_based --runtime=300 --ioengine=libaio --numjobs=2 --iodepth=1 --norandommap --randrepeat=0 --exitall


  • The above command will start a container with FIO application running inside it. FIO will use "/vol/newfile" for IO tests. "/vol" is using "disk_data" directory which is inside "/var/lib/docker/volumes". Once the test is complete, the container will exit.

Hope it was useful. Cheers!

Related posts

Docker 101 - Part3 - Persisting data using volumes

Docker 101 - Part2 - Basic operations

Docker 101 - Part1 - Installation


Docker 101 - Part3 - Persisting data using volumes

In this article, I will explain how to use Docker volumes for persisting data generated by and used by containers with --mount flag. Volumes use the Docker area and it can be found under /var/lib/docker/volumes/ directory of the Docker host.

Example:

docker run -dit --name centos_volume_test --mount source=data_volume01,target=/datavol01 centos sleep 1800

The above command will run a CentOS container and mounts a volume at /datavol01 inside the container. It uses source /var/lib/docker/volumes/data_volume01. The below screenshot shows the necessary steps to verify it.


Hope it was useful. Cheers!

Related posts


Docker 101 - Part2 - Basic operations

Docker 101 - Part1 - Installation


References


Friday, October 18, 2019

Docker 101 - Part2 - Basic operations

In this article, I will walk you through basic Docker commands and how to work with it for creating, managing, and monitoring Docker containers.

Docker version and info


#docker version


#docker info


Default directory for Docker


#cd /var/lib/docker


Pull images


#docker pull centos:latest 


List images


#docker images


Create bridge network


#docker network create -d bridge --subnet 10.0.0.0/24 ps-bridge

List all bridge networks


#brctl show

Inspect a network 


#docker network ls
#docker network inspect <name>


Run a container


#docker run -dt --name centos_test --network ps-bridge centos sleep 900


SSH into a container


#docker exec -it <name> sh


List running containers


#docker ps


List all containers


#docker ps -a

List container stats


#docker stats


Stop a container


#docker stop <Container ID>


Remove a container


#docker rm <Container ID>

Remove an image


#docker rmi <REPOSITORY:TAG>


Hope it was useful. Cheers!

Related posts


References


Docker 101 - Part1 - Installation

Enter cloud native! In this article, I will briefly explain how to build a virtual Docker host. Here I am installing Docker on a CentOS 7.4 virtual machine running on ESXi 6.5 which is part of a VMware vSAN cluster.

Prerequisites:
  • Deploy a basic CentOS 7.4 VM
  • Assign IP address and ensure the VM has internet connectivity
  • You should have root creds

Installation:
  • SSH to the CentOS VM as root
  • yum check-update
  • yum install -y yum-utils device-mapper-persistent-data lvm2
  • yum-config-manager --add-repo https://download.docker.com/linux/centos/docker-ce.repo
  • yum install docker-ce
  • systemctl start docker
  • systemctl enable docker
  • systemctl status docker

Verify version:
  • docker version

Run your first container:
  • docker run hello-world

Hope it was useful. Cheers! In the next part, I will explain basic Docker commands and operations.

Related posts


References


Wednesday, October 9, 2019

vRealize Operations Manager 7.5 - Part8 - Super Metrics

In this article, I will briefly explain about using super metrics in vROps 7.5. For example, I will take the VM NUMA optimization super metric which was released recently. You can download the super metric JSON file from the VMware sample exchange

Once the JSON file is downloaded, login to your vROps instance. Navigate to Administration - Configuration and select Super Metrics. Click on Import Super Metric.


Browse and select the JSON super metric file that you downloaded. Click DONE.


Once it is done, you can see the two super metrics. 


To enable the super metric in a policy:
Select the super metric - Edit Selected Super Metric - Goto Enable in a Policy  - Select vSphere Solution's Default Policy and click FINISH.


Now after the default collection interval, you can see the super metric tab as shown below. 


As you can see in the above screenshot, for this virtual machine "lustre01", recommendations are: 
  • NUMA optimal CPU socket: 1 
  • NUMA optimal CPU cores per socket: 8

Hope it was useful. Cheers!

References


Related posts

Monday, October 7, 2019

VMware PowerCLI 101 - Part5 - Real time storage IOPS and latency

It is very important to monitor and analyze the performance of storage subsystem components as it direcly affects the application performance. In this article, I will briefly explain how to use PowerCLI to get real time storage IOPS and latency of the following: 

              • Virtual disk
              • Datastore
              • Disk/ LUN 
              • Storage adapter
              • Storage path
Connect to vCenter server using:
Connect-VIServer <IP address of vCenter>

To understand the list of all available stats for a specific entity, you can use Get-StatType. For example, to list all real time stats for a virtual machine you can use:
Get-StatType -Entity <VM name> -Realtime | sort

Virtual disk

To get real-time IOPS and latency of all virtual disks of a VM named 'lustre01':
Get-Stat -Entity lustre01 -Realtime -MaxSamples 1 -Stat virtualDisk.numberReadAveraged.average,virtualDisk.numberWriteAveraged.average,virtualDisk.totalReadLatency.average,virtualDisk.totalWriteLatency.average | sort Instance,MetricId | select MetricId, Value, Unit, Instance


Datastore

To get real-time IOPS and latency of a datastore (with Uuid: 5bea72bb-5d72ed6a-1d85-246e96792988) from an ESXi host (IP: 192.168.105.10):
Get-Stat -Entity 192.168.105.10 -Stat datastore.numberReadAveraged.average,datastore.numberWriteAveraged.average,datastore.totalReadLatency.average,datastore.totalWriteLatency.average -Realtime -MaxSamples 1 -Instance 5bea72bb-5d72ed6a-1d85-246e96792988 | Select MetricId, Value, Unit, Instance | Sort-Object MetricId

Note: You can get Uuid of a datastore using (Get-Datastore vol01).ExtensionData.Info.Vmfs.Uuid


Refer my article "Real time VMware datastore performance monitoring using PowerShell" for monitoring the real time performance statistics of multiple shared VMFS datastores which are part of a multi-node VMware ESXi cluster.

Disk/ LUN

To get real-time IOPS and latency of a disk (eui.387de1af35b93f6ff0a9bef000000000): 
Get-Stat -Entity 192.168.105.10 -Disk -Realtime -Instance eui.387de1af35b93f6ff0a9bef000000000 -MaxSamples 1 -Stat disk.numberWriteAveraged.average,disk.numberReadAveraged.average,disk.totalWriteLatency.average,disk.totalReadLatency.average | Select MetricId, Value, Unit, Instance


Storage adapter

To get real-time IOPS and latency of a storage adapter: 
Get-Stat -Entity 192.168.105.10 -Realtime -MaxSamples 1 -Stat storageAdapter.totalReadLatency.average, storageAdapter.totalWriteLatency.average, storageAdapter.numberReadAveraged.average, storageAdapter.numberWriteAveraged.average -Instance vmhba64 | Select-Object MetricId, Value, Unit, Instance | Sort-Object MetricId


Storage Path

To get real-time IOPS and latency of a storage path:
Get-Stat -Entity 192.168.105.10 -Realtime -MaxSamples 1 -Stat storagePath.totalReadLatency.average, storagePath.totalWriteLatency.average, storagePath.numberReadAveraged.average, storagePath.numberWriteAveraged.average -Instance fc.300fb123ba76519c:b436362bae5b217-fc.300fb123ba76519c:b436362bae5b217-eui.387de1af35b93f6ff0a9beec00000001 | Select MetricId,Value,Unit,Instance | Sort-Object MetricId