Showing posts with label installation. Show all posts

Saturday, February 15, 2020

Kubernetes 101 - Part1 - Create K8s cluster with kubeadm


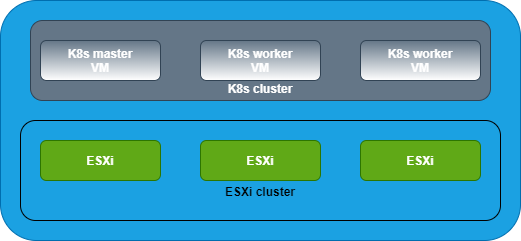
Deploy 3 CentOS 7 VMs. One will be the master and the other two will be workers/ slaves.
Master is "m1" and workers are "w1" and "w2".

Plan IP address
192.168.105.100 - m1
192.168.105.101 - w1
192.168.105.102 - w2
Step1: on all 3 nodes
vi /etc/hosts
192.168.105.100 m1
192.168.105.101 w1
192.168.105.102 w2
Step2: on all 3 nodes
#Disable firewall
sudo firewall-cmd --state
sudo systemctl stop firewalld
sudo systemctl disable firewalld
sudo systemctl status firewalld
setenforce 0
sed -i --follow-symlinks 's/SELINUX=enforcing/SELINUX=disabled/g' /etc/sysconfig/selinux
Step3: on all 3 nodes
#Configure iptables for Kubernetes
cat <<EOF > /etc/sysctl.d/k8s.conf
net.bridge.bridge-nf-call-ip6tables = 1
net.bridge.bridge-nf-call-iptables = 1
EOF
sysctl --system
Step4: on all 3 nodes
#Disable swap
swapoff -a
vi /etc/fstab (Edit fstab file and comment(#) swap partition)

reboot all 3 nodes
Step5: on all 3 nodes
#configure kubernetes repo
cat <<EOF > /etc/yum.repos.d/kubernetes.repo
[kubernetes]
name=Kubernetes
enabled=1
gpgcheck=1
repo_gpgcheck=1
EOF
Step6: Install docker on all 3 nodes
yum install docker -y
Step7: on all 3 nodes
yum install -y kubeadm kubectl kubelet --disableexcludes=kubernetes
systemctl daemon-reload
systemctl restart docker && systemctl enable --now docker
systemctl restart kubelet && systemctl enable --now kubelet
Step8: on master
kubeadm init --pod-network-cidr 10.244.0.0/16
Step9: on master
$ mkdir -p $HOME/.kube
$ sudo cp -i /etc/kubernetes/admin.conf $HOME/.kube/config
$ sudo chown $(id -u):$(id -g) $HOME/.kube/config
Step10: on master
Step11: on all worker nodes
Use the join token from master to join worker nodes to the K8s cluster.
Example:
kubeadm join 192.168.105.100:6443 --token 4j1cjv.gcj2hx9suq5akc7v \
--discovery-token-ca-cert-hash sha256:b2ead930d772d8af2e45ca8c86c3895b092484c10f8034e52f917e71dc4c3fea

Monday, December 16, 2019

vRealize Automation 8 - Part1 - Installation

Background


  • vRealize Automation (vRA) has two consumption models now:
    • vRA on-prem
    • vRA cloud (SAAS offering)
  • From vRA 8.0 onwards the same code being used in vRA cloud is taken and packaged together for on-prem use.
  • vRA 8.0 is focused on greenfield environments (new vRA deployments).
  • If you want to upgrade from vRA 7.x VMware recommends waiting until vRA 8.x as it will have a migration tool that helps the upgrade process. 

Before starting the installation process, I strongly recommend you to go through the below documentation links.


Installation


Download the installer ISO file and mount it. If you are running it from a Windows machine, browse to win32 folder and run installer.exe file. During the installation process first LCM VM will be deployed and it is responsible for deploying IDM and vRA VMs.

Note: Make sure DNS entries for LCM, IDM, and vRA are present and resolvable.

Click install.


Click next.


Accept EULA.


Provide vCenter details.


Accept.


Select a datacenter location.


Select a compute cluster.


Select a datastore.


Provide network configuration details.


Set password.


Provide LCM config details.


Provide IDM config details.


Provide vRA config details.


Review summary.


Click submit to start the installation process.


Once the installation is successful you will get the following URLs to navigate to vRSLCM and vRA UI.


Login to LCM.


Login to vRA.


Provide creds.


There you go! vRA 8.0 is successfully deployed.


Hope it was useful. Cheers!

References


Wednesday, July 3, 2019

vRealize Operations Manager 7.5 - Part4 - High availability

In this post, I will explain the steps to expand an existing vROps installation and enable high availability.

Before making a design/ architecture decision on enabling high availability for vROps I strongly recommend you to go through the below VMware vROps documentation links and understand the functional/ technical implications of it.

  1. About vRealize Operations Manager High Availability
  2. High Availability Considerations
  3. About vRealize Operations Manager Cluster Nodes

Expand an existing installation


Deploy a new vROps appliance. Once the deployment is complete, open the management IP of the appliance in a web browser. This time select expand an existing installation


Click next.

Provide a name for this new node.
Select the node type as "Data".
Provide the IP address or FQDN of the master node and click validate.
Accept the certificate and click next.


Provide admin password and click next.

Note: If you don't know the admin password you can request the vROps admin to provide a shared pass-phrase and can use it.

Click finish.

After this step, you will be redirected automatically to the admin page.


As you can see in the above screenshot, installation is in progress and is waiting to finish the cluster expansion. It may take a few minutes. Once it is complete you can see a button to "Finish adding new node(s)".


Click "Finish adding new node(s)" and click ok.


This will take a few minutes.


Now, you can see that the new data node is online and running. Next step is to enable high availability.  


Enable High Availability


To configure high availability, click "Enable".

Cluster Restart Required: The cluster needs to be restarted in order to configure HA. This may require up to 20 minutes during which vRealize Operations Manager will not be available.

To ensure complete protection the two nodes (Master and Replica) should not share hardware.

Click Ok.
Click "Yes" to continue HA configuration.


This will take a few minutes. The cluster will be taken offline for enabling HA.


After a few minutes, the cluster is back online and HA is enabled. And as you can see in the below screenshot one node is "Master" and the other one is "Master Replica".


vROps also has dashboards that provide you details on the health status of the complete vROps environment, cluster statistics and performance details of vROps itself, etc. Sample screenshot of the "Self Health" dashboard is shown below.  


Hope it was useful. Cheers!

Related posts:


Monday, July 1, 2019

vRealize Operations Manager 7.5 - Part3 - Rightsizing

In this article, I will briefly explain a performance optimization feature in vROps. This feature will help the user/ customer to easily find out a list of oversized and undersized VMs. vROps will provide recommendations on allocating the right amount of resources to the VM. 

Rightsizing


As you can see in the screenshot above, there are 29 VMs that are oversized. And vROps is providing recommendations on the amount of CPU and memory reduction that can be done to optimize performance. Oversizing always have a negative impact on the performance and it is recommended to allocate the right amount of resources to a VM for optimal performance. Let's take an example of one of the VM. 


You can see that the recommendation by vROps is to reduce 8 vCPUs and 15 GB of memory. This recommendation is based on the analytics and forecasting capabilities of vROps. You can click on the VM name and it will show more details regarding the selected VM.


vROps also provides a way to resize the VMs directly from the console. You can select the VMs that you would like to resize, and click "RESIZE VM(S)".


NOTE: The workloads may be interrupted as it may require restart during resizing. 

VMware guidance: CPU Ready time and Co-Stop values per core greater than 5% and 3% respectively could be a performance concern. 

Hope it was useful. Cheers!

Related posts:


Friday, June 21, 2019

vRealize Operations Manager 7.5 - Part2 - Configure vCenter adapter and dashboards overview

In this post, I will explain how to configure the vCenter adapter and will also walk through some of the native dashboards.

Configuring vCenter adapter


  • Login to vROps.
  • Click the Administration tab.
  • Select the vCenter Adapter. 
  • Click the gears icon.


  • Provide necessary details.


  • Test connection.


  • Click save settings and close.
  • Once the above steps are done, in a few seconds you can see "Adapter Status" as Data receiving and "Collection State" as Collecting.  

Note: After configuring the vCenter adapter you should actually wait for few days for all the data to get collected and populated.

Dashboards


This is the place where most of the System administrators/ Operations Engineers spend their time for understanding/ evaluating the operational aspects of their virtual infrastructure, capacity planning, troubleshooting various issues, performance optimizations, etc.  vROps has many pre-canned dashboards that you get out-of-the-box. Below screenshot shows how to select/ navigate multiple dashboards that are available in vROps.


Now, I will just briefly explain some of my favorite dashboards. 

Operations Overview


This dashboard provides data center summary. It provides info about the total number of clusters, hosts, total VMs, running VMs, datastores, etc. This dashboard also has widgets showing details about the top VMs experiencing CPU contention, memory contention, and disk latency.


Utilization Overview


This dashboard provides a summary of the environment based on the selection. In this case, I selected a cluster. It shows the total (CPU/ memory/ storage) capacity of the selected environment, usable capacity, used capacity, remaining capacity, etc. This will be very useful for capacity planning of resources.  

Cluster Utilization


This dashboard shows the CPU, memory, disk IOPS and network usage trends at the cluster level.


Datastore Utilization


This dashboard provides detailed info on datastore usage trends and heatmap based on datastore capacity/ utilization.


Heavy Hitter VMs


This dashboard provides cluster-level CPU, memory, IOPS and network throughput. It also gives a list of VMs which has generated the highest CPU demand, memory demand, highest IOPS and network throughput. This is very useful for identifying the VMs that has the highest resource consumption. 


Hope it was useful. Cheers!