Friday, May 15, 2020

Kubernetes 101 - Part3 - Install kubectl on Windows

This article shows how to install kubectl on a Windows machine and connect to a remote Kubernetes cluster.

Open PowerShell as administrator and run the following:
Install-Script -Name install-kubectl -Scope CurrentUser -Force


This will download the installation files to Windows PowerShell script folder of the current user. In my case it is: C:\Users\vineetha\Documents\WindowsPowerShell\Scripts


Now browse to the above location in Powershell and execute the install-kubectl.ps1 file.
install-kubectl.ps1 [-DownloadLocation <path>]

Note: If you do not specify a DownloadLocationkubectl will be installed in the user's temp directory.

Saturday, April 18, 2020

vSAN performance benchmarking

In this article, I will explain briefly on performance benchmarking considerations, factors affecting performance, and some of the best practices. We do performance benchmarking to understand the capabilities and bottlenecks of a system. When I say system it could be a storage system, CPU, GPU, network switch, etc. Now let's consider a VMware vSAN cluster infrastructure. It includes multiple components and each of these contributes to the performance. In this case, the vSAN cluster is the solution under test. We will have to conduct performance benchmarking to understand the storage performance behavior of the cluster. When I say storage behavior it includes the IOPS, latency, and throughput that the cluster can produce under varying loads.

The goal of benchmarking
  • Identify bottlenecks
    • Hardware bottleneck
    • Software bottleneck
    • Application bottleneck
  • Compare tradeoffs
  • Manage expectations
  • Make decisions

Usually in a real-world scenario, benchmarking will be done once the cluster is deployed/ ready and before starting to host production workload on top of it. As these benchmark values define the performance maximums it will be helpful to decide on when to scale or upgrade the cluster before it hits a bottleneck.

Fundamental factors of vSAN performance

Server hardware
  • Compatibility as per vSAN HCL
Host
  • Number of hosts in the cluster
  • Power settings
  • CPU - number of cores and frequency 
Storage
  • Hybrid or All-flash
  • NVMe, SAS, or SATA
  • Number of disk groups per host
  • Storage controller configuration
  • Compatibility of hardware devices as per vSAN HCL
Network
  • 10/ 25/ 40 GbE
  • MTU 
  • LAG
SPBM policy
  • FTT (Failures To Tolerate)
  • FTM (Mirroring/ Erasure coding)
  • Thin or Thick provision
Security
  • Encryption
  • Checksum
Other
  • Stripe width
  • Flash read cache reservation
  • IOPS limit for object
All of the above factors will affect performance. So you should know the benefits and tradeoffs. 

Benchmarking methodology

Image credit: VMware

Storage benchmarking tools

IO load generation tools
Application-specific tools
  • HammerDB (MSSQL, Oracle)
  • Jetstress (MS Exchange)
  • SLOB (Oracle)
  • DBGen (MSSQL, Oracle)

Best practices

  • Understand the production performance metrics.
  • Test what you plan to deploy.
  • Workload modeling.
  • Plan for use case testing.
  • Choose an appropriate size for benchmarking
  • Choose the right tool.
  • Pre-allocate blocks while testing.
  • Test for a longer time duration.
  • Deploy multiple VMs with multiple VMDKs.

References

Saturday, March 21, 2020

vRealize Operations Manager 8 - Custom views and reports

vROps has a number of inbuilt views and reports templates. In this post, I will explain how to create custom views and reports. 

To create a new view: Dashboards - Views - New view

Provide a name and description for the new view. Here, for example, I will create a view that shows datastore write performance stats.


Select List.


Select Datastore as subject and group it by cluster compute resource.


Drag and drop the selected metrics or properties to include in the view.
In the following screenshot, I selected a property "Is Local" and included in the view.


Added another property "Type" to the view.


Similarly, I added some metrics like Write IOPS, Latency and Throughout to the view.
I selected "Maximum" from transformation to get the peak value of the selected metrics.


In the below screenshot, you can see I selected "Maximum" and "Average" transformation for Write IOPS, Latency and Throughput metrics. You can also select the units as per your requirement. Here, I selected "us" for latency and "MBps" for throughput.

Click Save. 


Similarly, I created three custom views that show:
  • "Datastore read performance stats"
  • "Datastore write performance stats" 
  • "Datastore capacity usage"


To create a new report template: Dashboards - Reports - New template


Provide a name and description for the new report template.


From the views and dashboards, find the three custom datastore views that we created earlier, drag and drop them to the right pane as shown below.


Select PDF and CSV.


Select all the layout options if you like to and click Save.


Now the custom report template is created. You can select it and click Run.


Select vSpehre Hosts and Clusters and then select vSphere World and click ok.


The report will run in the background and will be available to download under the "Generated Reports" tab. You can select it and download the PDF or CSV file.


You can even configure a schedule to generate a report and email it or save it to a location automatically based on your requirements. Hope it was useful. Cheers!

Related posts


Friday, February 21, 2020

VMware PowerCLI 101 - part7 - Working with vROps

This article explains how to work with vROps resources using PowerCLI. The following diagram shows the relationship between adapters, resource kinds, and resources. There can be multiple adapters installed on the vROps instance. Each adapter kind will have multiple resource kinds and each resource kind will have multiple resources. And each resource will have its own badges and badge scores.


Note I am using the following versions:
PowerShell: 5.1.14393.3383
VMware PowerCLI: 11.3.0.13990089
vROps: 7.0

Connect to vROps:
Connect-OMServer <IP of vROps>

Get the list of all installed adapters:
Get-OMResource | select AdapterKind -Unique


Get all resource kinds of a specific adapter:
Get-OMResource -AdapterKind VMWARE | select ResourceKind -Unique


Get the list of resources of a specific resource kind:
Get-OMResource -ResourceKind Datacenter


Another example:
Get-OMResource -ResourceKind ClusterComputeResource


Get details of a specific resource:
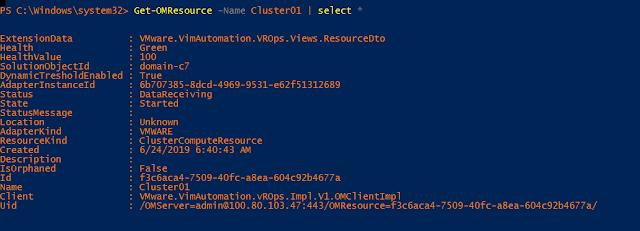
Get-OMResource -Name Cluster01 | select *


Get badge details of a selected resource:
(Get-OMResource -Name Cluster01).ExtensionData.Badges


List all resources of an adapter kind where health is not green:
Get-OMResource -AdapterKind VMWARE | select AdapterKind,ResourceKind,Name,Health,State,Status | where health -ne Green | ft


Get the list all objects of an adapter kind that have collection issues:
Get-OMResource -AdapterKind VMWARE | select AdapterKind,ResourceKind,Name,Health,State,Status | where {($_.Status -ne "DataReceiving") -or ($_.State -ne "Started")} | ft


Get the list of all active critical alerts from a specific adapter type:
Get-OMResource -AdapterKind VMWARE | Get-OMAlert -Criticality Critical -Status Active


Hope it was helpful. Cheers!

Related posts

VMware PowerCLI 101 Blog Series