Showing posts with label virtualization. Show all posts

Wednesday, July 3, 2019

vRealize Operations Manager 7.5 - Part4 - High availability

In this post, I will explain the steps to expand an existing vROps installation and enable high availability.

Before making a design/ architecture decision on enabling high availability for vROps I strongly recommend you to go through the below VMware vROps documentation links and understand the functional/ technical implications of it.

  1. About vRealize Operations Manager High Availability
  2. High Availability Considerations
  3. About vRealize Operations Manager Cluster Nodes

Expand an existing installation


Deploy a new vROps appliance. Once the deployment is complete, open the management IP of the appliance in a web browser. This time select expand an existing installation


Click next.

Provide a name for this new node.
Select the node type as "Data".
Provide the IP address or FQDN of the master node and click validate.
Accept the certificate and click next.


Provide admin password and click next.

Note: If you don't know the admin password you can request the vROps admin to provide a shared pass-phrase and can use it.

Click finish.

After this step, you will be redirected automatically to the admin page.


As you can see in the above screenshot, installation is in progress and is waiting to finish the cluster expansion. It may take a few minutes. Once it is complete you can see a button to "Finish adding new node(s)".


Click "Finish adding new node(s)" and click ok.


This will take a few minutes.


Now, you can see that the new data node is online and running. Next step is to enable high availability.  


Enable High Availability


To configure high availability, click "Enable".

Cluster Restart Required: The cluster needs to be restarted in order to configure HA. This may require up to 20 minutes during which vRealize Operations Manager will not be available.

To ensure complete protection the two nodes (Master and Replica) should not share hardware.

Click Ok.
Click "Yes" to continue HA configuration.


This will take a few minutes. The cluster will be taken offline for enabling HA.


After a few minutes, the cluster is back online and HA is enabled. And as you can see in the below screenshot one node is "Master" and the other one is "Master Replica".


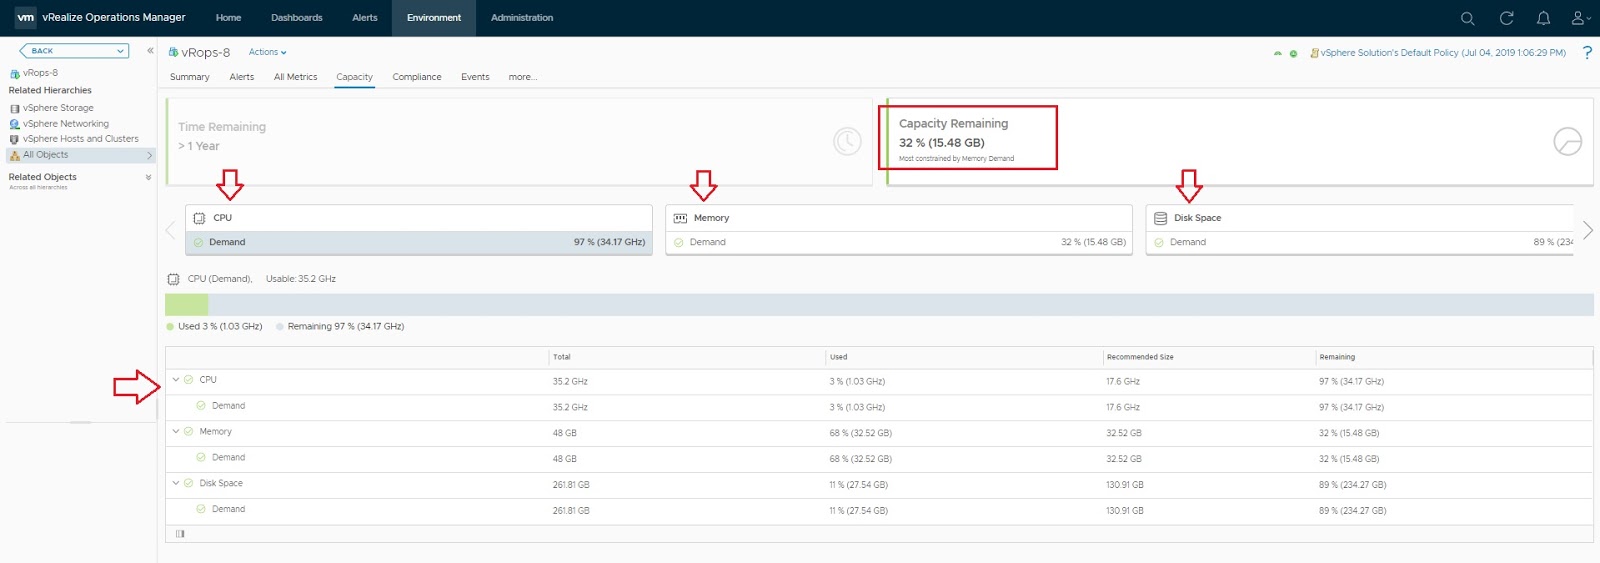
vROps also has dashboards that provide you details on the health status of the complete vROps environment, cluster statistics and performance details of vROps itself, etc. Sample screenshot of the "Self Health" dashboard is shown below.  


Hope it was useful. Cheers!

Related posts:


Monday, July 1, 2019

vRealize Operations Manager 7.5 - Part3 - Rightsizing

In this article, I will briefly explain a performance optimization feature in vROps. This feature will help the user/ customer to easily find out a list of oversized and undersized VMs. vROps will provide recommendations on allocating the right amount of resources to the VM. 

Rightsizing


As you can see in the screenshot above, there are 29 VMs that are oversized. And vROps is providing recommendations on the amount of CPU and memory reduction that can be done to optimize performance. Oversizing always have a negative impact on the performance and it is recommended to allocate the right amount of resources to a VM for optimal performance. Let's take an example of one of the VM. 


You can see that the recommendation by vROps is to reduce 8 vCPUs and 15 GB of memory. This recommendation is based on the analytics and forecasting capabilities of vROps. You can click on the VM name and it will show more details regarding the selected VM.


vROps also provides a way to resize the VMs directly from the console. You can select the VMs that you would like to resize, and click "RESIZE VM(S)".


NOTE: The workloads may be interrupted as it may require restart during resizing. 

VMware guidance: CPU Ready time and Co-Stop values per core greater than 5% and 3% respectively could be a performance concern. 

Hope it was useful. Cheers!

Related posts:


Friday, June 21, 2019

vRealize Operations Manager 7.5 - Part2 - Configure vCenter adapter and dashboards overview

In this post, I will explain how to configure the vCenter adapter and will also walk through some of the native dashboards.

Configuring vCenter adapter


  • Login to vROps.
  • Click the Administration tab.
  • Select the vCenter Adapter. 
  • Click the gears icon.


  • Provide necessary details.


  • Test connection.


  • Click save settings and close.
  • Once the above steps are done, in a few seconds you can see "Adapter Status" as Data receiving and "Collection State" as Collecting.  

Note: After configuring the vCenter adapter you should actually wait for few days for all the data to get collected and populated.

Dashboards


This is the place where most of the System administrators/ Operations Engineers spend their time for understanding/ evaluating the operational aspects of their virtual infrastructure, capacity planning, troubleshooting various issues, performance optimizations, etc.  vROps has many pre-canned dashboards that you get out-of-the-box. Below screenshot shows how to select/ navigate multiple dashboards that are available in vROps.


Now, I will just briefly explain some of my favorite dashboards. 

Operations Overview


This dashboard provides data center summary. It provides info about the total number of clusters, hosts, total VMs, running VMs, datastores, etc. This dashboard also has widgets showing details about the top VMs experiencing CPU contention, memory contention, and disk latency.


Utilization Overview


This dashboard provides a summary of the environment based on the selection. In this case, I selected a cluster. It shows the total (CPU/ memory/ storage) capacity of the selected environment, usable capacity, used capacity, remaining capacity, etc. This will be very useful for capacity planning of resources.  

Cluster Utilization


This dashboard shows the CPU, memory, disk IOPS and network usage trends at the cluster level.


Datastore Utilization


This dashboard provides detailed info on datastore usage trends and heatmap based on datastore capacity/ utilization.


Heavy Hitter VMs


This dashboard provides cluster-level CPU, memory, IOPS and network throughput. It also gives a list of VMs which has generated the highest CPU demand, memory demand, highest IOPS and network throughput. This is very useful for identifying the VMs that has the highest resource consumption. 


Hope it was useful. Cheers!

Friday, June 7, 2019

VMware PowerCLI 101 - Part3 - Basic VM operations

Previous posts of this blog series talked about how to install PowerCLI, connecting to ESXi host and basics of working with the vCenter server. In this article, we will go through basic VM operations.

Get basic VM details:
Get-VM -Name <name of the virtual machine>

To view all properties of a VM object:
Get-VM -Name <name of the virtual machine> | Get-Member

To start a VM:
Get-VM -Name <name of the virtual machine> | Start-VM

To restart a VM:
Get-VM -Name <name of the virtual machine> | Restart-VMGuest

To shut down a VM:
Get-VM -Name <name of the virtual machine> | Shutdown-VMGuest

To delete a VM permanently:
Get-VM -Name <name of the virtual machine> | Remove-VM -DeletePermanently

Let's have a look into the "ExtensionData" property of a virtual machine.

Status related details of a VM:
(Get-VM -Name <name of the virtual machine>).ExtensionData | select GuestHeartbeatStatus,OverallStatus,ConfigStatus


CPU, Memory config details of a VM:
(Get-VM -Name <name of the virtual machine>).ExtensionData.Config.Hardware


CPU, Memory hot add/ remove features:


Layout details of a VM:
(Get-VM -Name <name of the virtual machine>).ExtensionData.LayoutEx.File | sort Key | ft


VM tools status and other guest details:
(Get-VM -Name <name of the virtual machine>).ExtensionData.Guest


Network related info of a VM:
(Get-VM -Name <name of the virtual machine>).ExtensionData.Guest.Net


Hope this was useful. Cheers!

Friday, May 24, 2019

VMware PowerCLI 101 - Part2 - Working with vCenter server

In my previous blog, we discussed how to install PowerCLI module and connect to a stand-alone ESXi host. Now let's start with connecting to the vCenter server.

Connect-VIServer <IP of vCenter server>

Get the list of data centers present under this vCenter server: Get-Datacenter


Get the list of clusters under a datacenter: Get-Datacenter DC01 | Get-Cluster

To verify the status of HA, DRS, and vSAN of a cluster:
(Get-Cluster Cluster01) | select Name,DrsEnabled,DrsAutomationLevel,HAEnabled,HAFailoverLevel,VsanEnabled


Get the list of ESXi hosts part of a specific cluster: 
Get-Datacenter DC01 | Get-Cluster Cluster01 | Get-VMHost


To get the list of VMs hosted on a specific ESXi host:
Get-Datacenter DC01 | Get-Cluster Cluster01 | Get-VMHost 192.168.105.11 | Get-VM


To get a list of powered on and powered off VMs:
(Get-Cluster Cluster01 | Get-VM).where{$PSItem.PowerState -eq "PoweredOn"}
(Get-Cluster Cluster01 | Get-VM).where{$PSItem.PowerState -eq "PoweredOff"}


An efficient way of doing it in a single go is given below:
$vmson, $vmsoff = (Get-Cluster Cluster01 | Get-VM).where({$PSItem.PowerState -eq "PoweredOn"}, 'split')

$vmson will have the list of VMs that are PoweredOn and $vmsoff will have the list of VMs that are PoweredOff.


Cluster level inventory:
Get-Cluster | Get-Inventory

Datastore details of a cluster:
Get-Cluster | Get-Datastore | select Name, FreeSpaceGB, CapacityGB, FileSystemVersion, State


Hope this was useful. Cheers! In the next post, we will talk about performing basic VM operations using PowerCLI.

Friday, May 17, 2019

VMware PowerCLI 101 - Part1 - Installing the module and working with stand-alone ESXi host

This blog post series is for all those who would like to kickstart and learn VMware PowerCLI from the very basic level. Let's start with installing the PowerCLI module.

First, verify whether VMware.PowerCLI module is already installed on your machine.


Get-Module VMware.PowerCLI -ListAvailable


In this case, as shown above, VMware.PowerCLI module is not installed. Now let's find the latest version of the module available from PowerShell gallery.

Find-Module VMware.PowerCLI


11.2.0.12780525 is the latest version that is available in PSGallery.

To install this module use: Install-Module VMware.PowerCLI


Installation of this module may take a couple of minutes as this is the very first time. Once successfully installed you can verify using: Get-Module VMware.PowerCLI -ListAvailable

To list all the available cmdlets: Get-Command -Module VMware*

Now, let's go ahead and connect to an ESXi host.

Connect-VIServer <IP of ESXi server>

Provide the necessary credentials and once connected successfully you will see the below.


To get basic details of the ESXi host: Get-VMHost <IP of ESXi server>


To get more information about a cmdlet you can make use of the PowerShell Help System.

You can find all the properties and methods available for an object using: Get-Member

Example: Get-VMHost 192.168.105.1 | Get-Member

To retrieve specific properties of an ESXi host object: 

$h1 = Get-VMHost 192.168.105.1

Model detail: $h1.Model
Processor type: $h1.ProcessorType


Another very useful property is "ExtensionData". Let's have a detailed look at this property.


This property provides you a lot of info regarding system runtime, hardware health status, etc.


System and hardware health status:


Memory and CPU health status:


Configuration status: $h1.ExtensionData.ConfigStatus
Configuration issues: $h1.ExtensionData.ConfigIssue

Few more useful details that are available under "ExtensionData" are given below.


There is a property called "RebootRequired" which actually shows whether there is any pending reboot for the system.

System uptime and resource utilization are available under "QuickStats" property.


Note:
"OverallCpuUsage" is in MHz, "OverallMemoryUsage" is in MB and "Uptime" is in Seconds.

List of all system capabilities: $h1.ExtensionData.Capability

BIOS version: $h1.ExtensionData.Hardware.BiosInfo


In the next article, we will discuss connecting to the vCenter server using PowerCLI and performing day-to-day operations. Hope this was useful. Cheers!

Related posts: