Showing posts with label VMware. Show all posts

Friday, January 1, 2021

Dell EMC PowerFlex MP for vROps 8.x - Part7 - Create custom reports

In March 2020, I published a blog on how to create custom views and reports in vROps 8.x. This article explains how to create a custom storage report for Dell EMC PowerFlex using the PowerFlex Management Pack for vROps 8.x. 

Sample PowerFlex Storage Report PDF and template is available in my GitHub repo for download. You can use it as a starting point/ modify it as per requirement.

To create a new view: Dashboards - Views - Add.

Provide a name and description for the new view. Here, for example, I will create a view that shows PowerFlex Protection Domain Info.


Select List.


Select Protection Domain as subject and group it by PowerFlex Rack/ Appliance System.


Double click or drag and drop the selected metrics or properties to include in the view. In the following screenshot, I selected 4 capacity metrics to include in the view.


You can also select and change the units and transformation as per requirements. Once it is done, click Save.

Now a view is created. Similarly, you can create multiple views for the different PowerFlex resource kinds. The next step is to include this view in an existing template or in a new template. 

To create a new report template: Dashboards - Reports - Add.

  • Provide a name and description for the new report template.
  • From the views and dashboards, find the PowerFlex Protection Domain Info view that we created earlier, double-click or drag and drop them to the right pane. You can add multiple views to be included in this report template.
  • Select PDF and CSV.
  • Select all the layout options if you like to and click Save.
  • Now the custom report template is created. You can select it and click Run.

Select PowerFlex and then select PowerFlex World and click ok.


The report will run in the background and will be available to download under the "Generated Reports" tab. You can select it and download the PDF or CSV file. You can even configure a schedule to generate a report and email it or save it to a location automatically based on your requirements. Hope it was useful. Cheers!

Related posts


Monday, December 28, 2020

vSphere with Tanzu using NSX-T - Part3 - Edge Cluster

In the previous post, we went through basic NSX-T configurations. The next step is to deploy Edge VMs and create an Edge cluster. Before creating Edge VMs, we need to create two trunk port groups on the VDS using the VCSA web UI. Uplinks of the Edge VMs will be connected to these two trunk port groups.

  • Create 2 trunk port groups on the VDS.
    • "Trunk01-NSXT-Edge"
    • "Trunk02-NSXT-Edge"


  • Add Edge Transport Nodes.
    • Create two Edge VMs "edge-01, edge-02".
    • Click ADD EDGE VM, follow the wizard, and provide all the details.


  • Click Finish. Follow the same process and deploy one more Edge VM.

  • The next step is to create an Edge Cluster "edge-cluster-01and add the two Edge VMs to it.


The NSX-T Edge Cluster is now ready. Next, we have to add a Tier-0 Gateway and configure BGP peering with the router or L3 TOR switches. This will be covered in the next part. Hope it was useful. Cheers!

Related posts


Part1: Prerequisites
Part2: Configure NSX-T

Tuesday, December 8, 2020

vSphere with Tanzu using NSX-T - Part2 - Configure NSX

In this post, we will take a look at the different configuration steps that are required before enabling workload management to establish connectivity to the supervisor cluster, supervisor namespaces, and all objects that run inside the namespaces, such as vSphere pods, and Tanzu Kubernetes Clusters. 

At this point, I assume that the vSAN cluster is up and NSX-T 3.0 is installed. NSX-T appliance is connected to the same management network where the VCSA and ESXi nodes are connected. In my case, it will be through VLAN 41. Note that all the ESXi nodes of the vSAN cluster are connected to one vSphere Distributed Switch and has two uplinks from each node that connects to TOR A and TOR B.


NSX-T configurations

  • Add Compute Managers. I've added the vCenter server here.


  • Add Uplink Profiles.
    • Create a host uplink profile "nsx-uplink-profile-lbsrc" (this is for host TEP using VLAN 52).
    • Create an edge uplink profile "nsx-edge-uplink-profile-lbsrc" (this is for edge TEP using VLAN 53).


  • Add Transport Zones.
    • Create an overlay transport zone "tz-overlay".
    • Create a VLAN transport zone "edge-vlan-tz".


  • Add IP Address Pools.
    • Create an IP address pool for host TEPs "TEP-Pool-01" (this is for host TEP using VLAN 52).
    • Create an IP address pool for edge TEPs "Edge-TEP-Pool-01" (this is for Edge TEP using VLAN 53).


  • Add Transport Node Profiles.


  • Configure Host Transport Nodes. Select the required cluster and click configure NSX to convert all the ESXi nodes as transport nodes.

The next step is to deploy Edge VMs (Edge Transport Nodes) and create a Edge Cluster. We will cover it in the next part. Hope it was useful. Cheers!

Related posts


Part1 - Prerequisites


References


Monday, December 7, 2020

vSphere with Tanzu using NSX-T - Part1 - Prerequisites

In this blog series, I would like to share my experience deploying vSphere with Tanzu using NSX-T 3.0 networking. Following is a very high-level workflow of setting up the environment from scratch:


Software versions used for this study:
  • vSphere 7 U1
  • NSX-T 3.0.1.1

If you are using VCF, some of the deployment steps mentioned above are already automated. But, VCF is not in the scope of this blog series, and this post is aimed at explaining the workflow and background configurations that are required to prepare the environment before enabling workload management. This will be useful to understand the backend configuration tasks and logical workflow and will be helpful in case of troubleshooting too. In my lab, I have 4 Dell EMC PowerEdge rack servers connected to 2 TOR switches with 2 uplinks from each server. This is a consolidated architecture where both management components and application workload run on the same 4 node vSAN cluster. I am using ESXi 7 U1 and VCSA 7 U1. Here, the TORs are acting as L3 switches and we are doing BGP peering between TOR switches and NSX-T T0 Gateway which will be explained in a later part of this blog series.

Network connectivity


IP address schema and VLANs


I will not be covering how to create VLANs, configuring switch ports, deploying a vSAN cluster, etc. I assume that the network switches are correctly configured and the vSAN cluster is up and running. The next step is to deploy an NSX-T 3.0 appliance. You can either deploy it as a single node or in HA using 3 NSX-T appliances. In my lab, I have only one NSX-T 3.0 instance. Following are some of the reference material to deploy NSX-T 3.0:

Saturday, November 28, 2020

Storage performance benchmarking of Tanzu Kubernetes Clusters

Benchmarking of IT infrastructure is standard practice and is usually done before putting it into a production environment. It gives you baseline values about different performance aspects of the system/ solution under test. These benchmarking principles are applicable for Kubernetes clusters too. But the test cases and evaluation criteria may slightly vary compared to benchmarking a traditional IT infrastructure. 

Following are some of the test considerations:

  • Performance of PVCs.
    • Time to provision PVCs.
    • Read/ Write IOPS and Latency of PVCs.
  • Pod startup latency.
  • The time consumed to complete the deployment of different K8s objects.
    • Statefulset
    • Deployment etc.
  • Performance behavior of sample application workloads.
  • Network performance and connectivity between different K8s nodes.

In this article, I will explain a quick and easy way to benchmark the storage system used by the Kubernetes cluster to provision PVCs for application workloads. I am using FIO to generate storage IOs. You can use the following YAML file to deploy FIO pods as a statefulset. Note that here I am using PowerFlex VVOL datastore as Cloud Native Storage (CNS) for Tanzu K8s clusters and so the storage class "powerflex-storage-policy". This may differ in your case, and you might need to modify it to match the storage class available in your setup.


This YAML file will deploy a statefulset with 15 FIO pods (as per the number of replicas mentioned) and will start the storage IO stress test (8k block size, 70% random reads, 30% random writes, 2 jobs, 16 iodepth) on the attached PVC as and when the pod is started. Total 15 PVCs will be created in this case, and one PVC will get attached to one FIO pod. 

Note: If you get an error "forbidden: unable to validate against any pod security policy" after applying the above statefulset, then the pods will not get created. You will need to first create and apply Pod Security Policy (PSP) to the Tanzu Kubernetes Cluster.


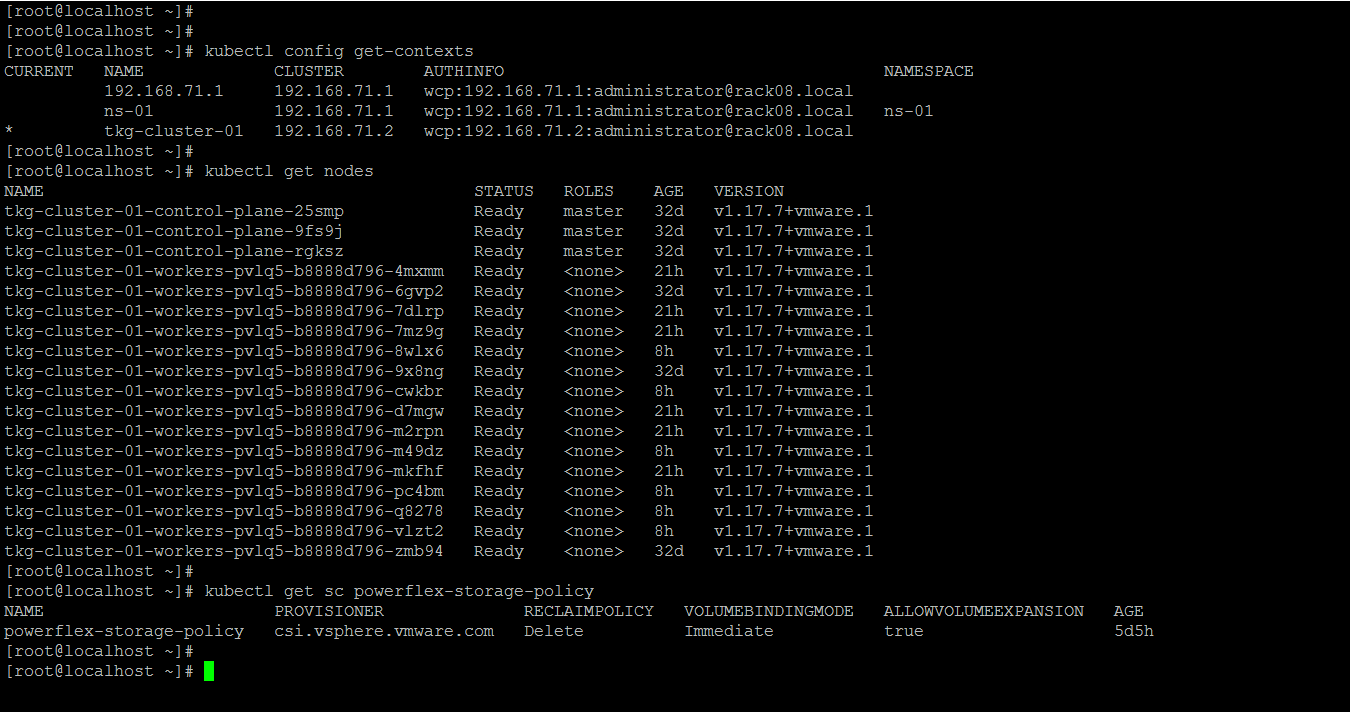
Following is an overview of my vSphere with Tanzu setup:

Tanzu K8s control plane nodes/ master VMs: 3
Tanzu K8s worker nodes/ VMs: 15


Contexts, Tanzu K8s cluster nodes, and storage class.


Create a statefulset using the above YAML file.
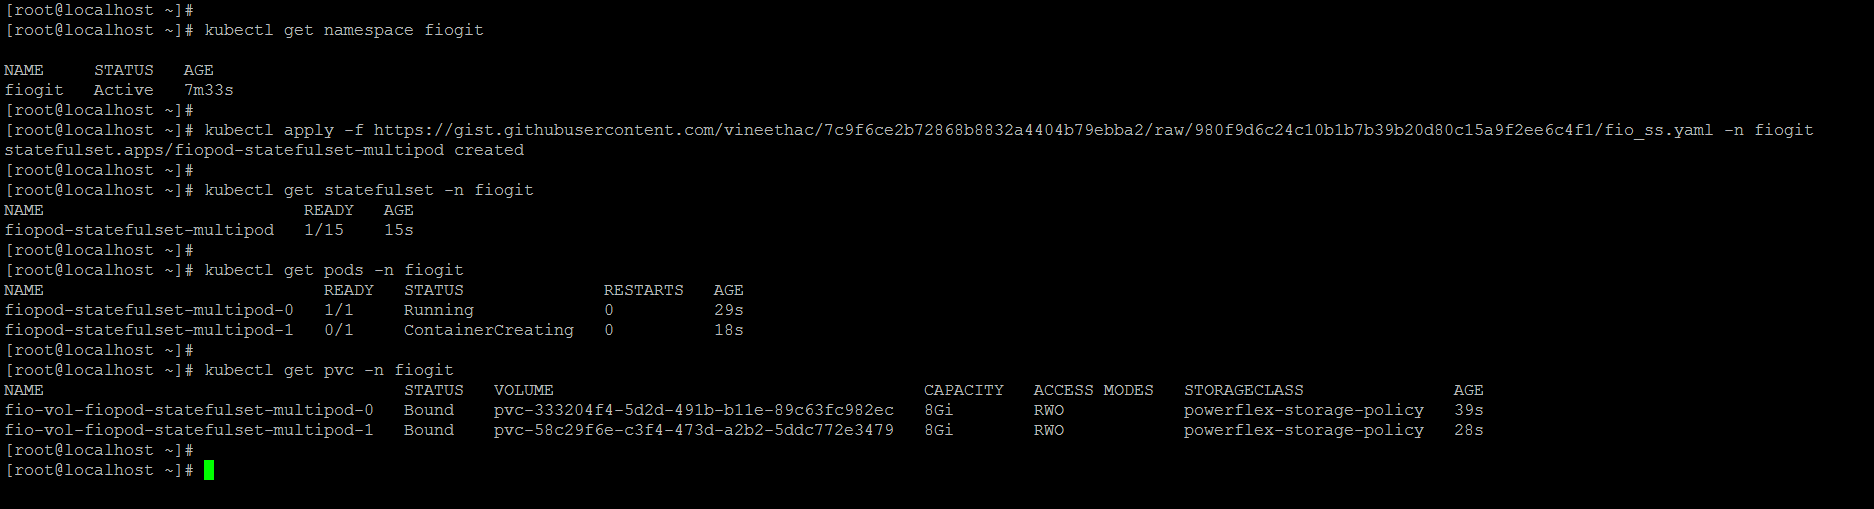
kubectl apply -f https://gist.githubusercontent.com/vineethac/7c9f6ce2b72868b8832a4404b79ebba2/raw/980f9d6c24c10b1b7b39b20d80c15a9f2ee6c4f1/fio_ss.yaml -n <namespace name>


You can see that it took roughly 6 minutes to deploy 15 FIO pods and corresponding PVCs. The time may vary depending on whether the FIO image is locally available on the nodes, available resources on the nodes, etc.  


As and when each pod is created, FIO will automatically start IO stress on it. IOs will be read/ written into the attached PVCs. As I mentioned earlier, I am using a storage class "powerflex-storage-policy" and this is associated with a VVOL datastore backed by a PowerFlex storage pool. In this case, all the PVCs are created in a PowerFlex VVOL datastore.


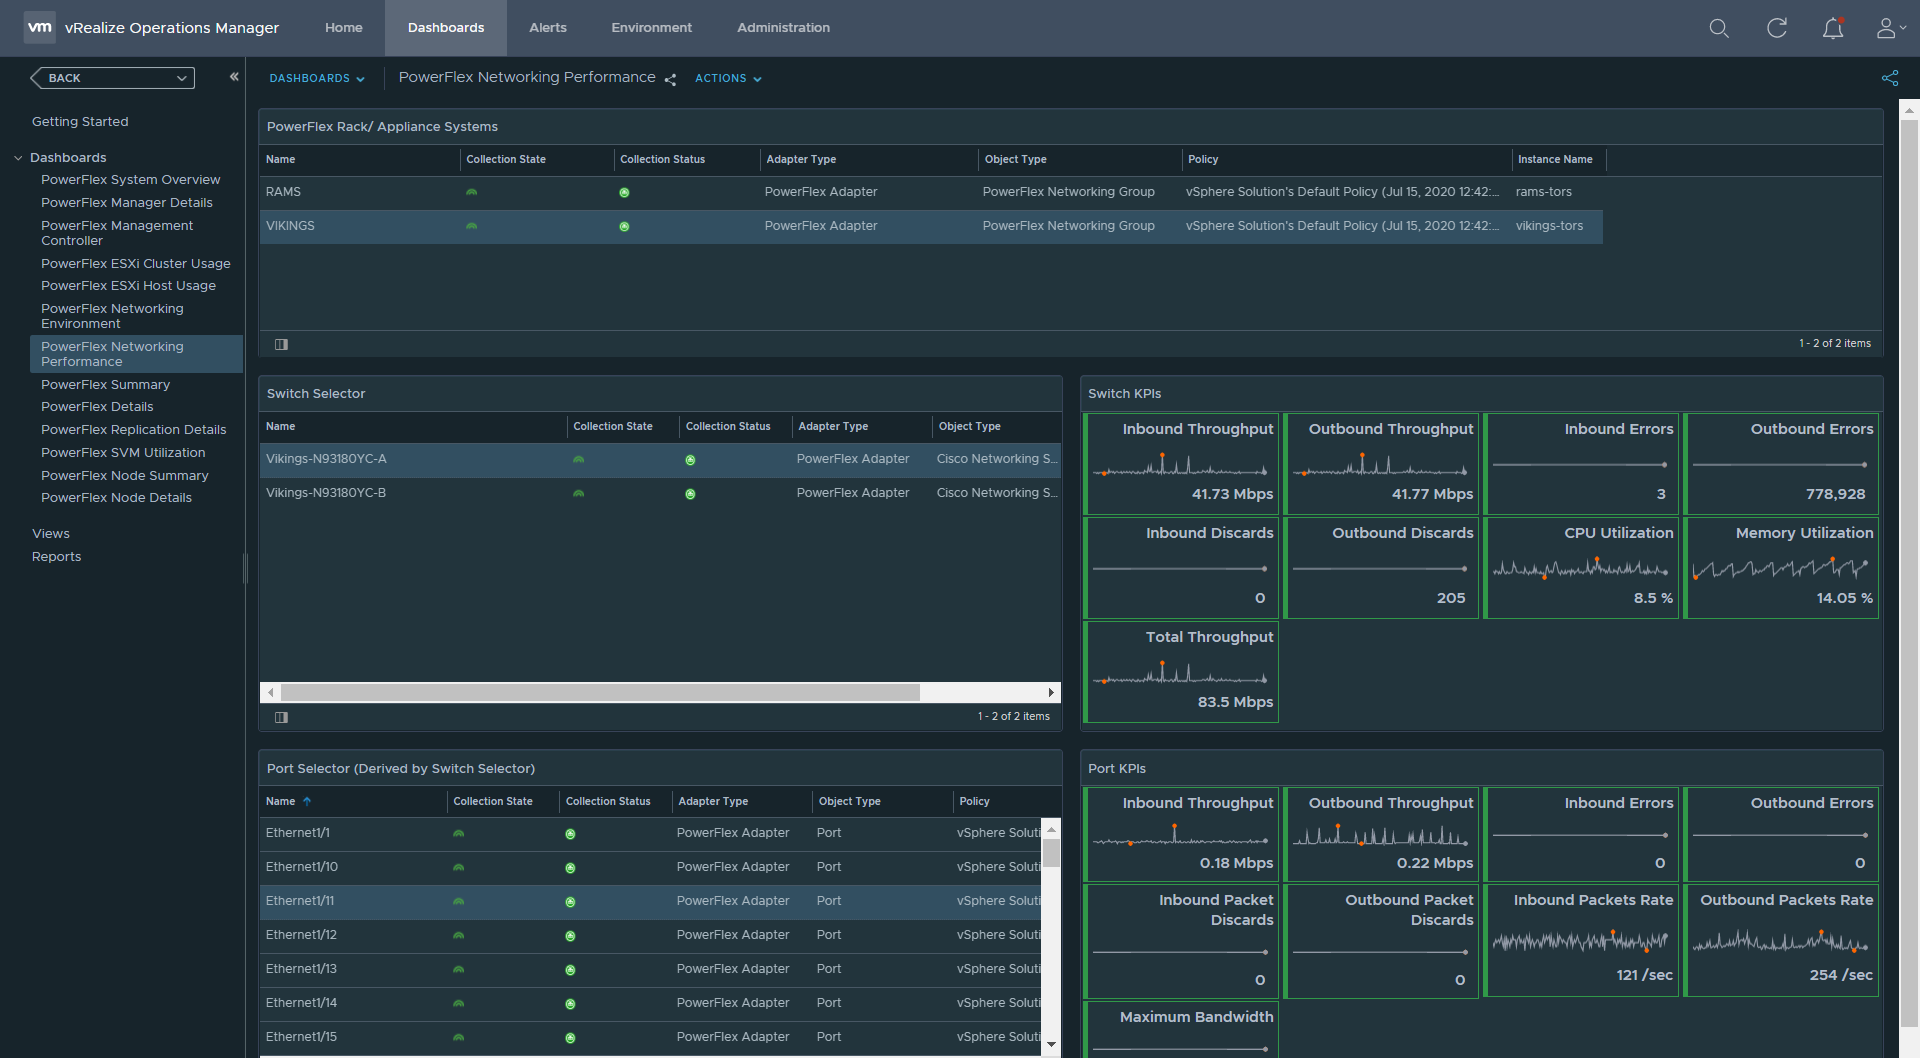
You can also see multiple volumes in the PowerFlex UI and all those volume names starting with "vasa" are externally managed by the PowerFlex VASA provider. The performance of each volume can be also be monitored using the PowerFlex UI.


If you would like to see the historical performance data, you can use vROps. Dell EMC has recently released a vROps management pack for PowerFlex systems. It is a monitoring and alerting solution that provides extensive visibility into the PowerFlex infrastructure. For monitoring K8s clusters and resources, you can use the vROps management pack for container monitoring


Note: When the duration mentioned in the FIO test is over, the pods will get restarted and the IO stress will also start. To modify the FIO parameters you can use kubectl edit statefulset fiopod-statefulset-multipod -n fiogit modify required parameters and save it. After saving it the new changes will get applied automatically. Once you are done with the testing, you can delete the statefulset and the corresponding PVCs using kubectl delete command. This method is useful when you want to test something quickly or if you have only less test profiles. If you have many test profiles with varying block sizes, iodepth, etc, then you will need to build a small script or something to automate the process. 

Hope it was useful. Cheers!


Related articles


References


Sunday, November 8, 2020

Dell EMC PowerFlex MP for vROps 8.x - Part4 - Resource kinds and relationships

In this post, we will take a look at the different resource kinds that are part of the Dell EMC PowerFlex Management Pack. Following is a very high-level logical representation of the PowerFlex Adapter resource kinds and their relationships:


Go to Environment - All objects - PowerFlex Adapter


You can also get a PowerFlex system level view in vROps using the PowerFlex rack/ appliance system resource kind. This system view is making use of the system name field that we provided while configuring each PowerFlex Adapter instance type. The system name is used to group all the logical components of one PowerFlex system. 


This view provides end-to-end visibility of the PowerFlex infrastructure components that will be useful to understand the relationship between different layers of the stack. This will be also helpful to identify and troubleshoot in case of issues.

Hope it was useful. Cheers!

Related posts


Part1 - Install
Part2 - Configure
Part3 - Dashboards


Wednesday, November 4, 2020

Dell EMC PowerFlex MP for vROps 8.x - Part3 - Dashboards

We have covered the installation and configuration of the PowerFlex Management Pack in the previous posts. In this post, we will have a look at the different dashboards that are part of the MP. Following are the 13 dashboards you will get after installing the MP:

Overview
  • PowerFlex System Overview
PowerFlex Manager
  • PowerFlex Manager Details
Management Controller 
  • PowerFlex Management Controller
Compute
  • PowerFlex ESXi Cluster Usage
  • PowerFlex ESXi Host Usage
  • PowerFlex SVM Utilization
Networking
  • PowerFlex Networking Environment
  • PowerFlex Networking Performance
Storage
  • PowerFlex Summary
  • PowerFlex Details
  • PowerFlex Replication Details
Server Hardware
  • PowerFlex Node Summary
  • PowerFlex Node Details

Now, let's have a quick look at some of these dashboards and their functionality.

PowerFlex Node Summary


This dashboard shows the health of all PowerFlex nodes being monitored by the MP. You can see the classification of nodes as Compute Only, Storage Only, Hyperconverged, and Management Controller along with a relationship between a node and its corresponding hardware components.


PowerFlex Summary


This dashboard shows the health status of all the logical components of the PowerFlex storage system. It also has a parent-child relationship between different objects of the storage system. You can also see widgets for capacity usage trend forecasting, alerts, top storage pools by capacity usage, top volumes by size, etc.


PowerFlex Details


This dashboard shows all PowerFlex storage performance KPIs like IOPS, Bandwidth, Latency, etc.


PowerFlex Networking Environment


You can see the health status of Cisco networking components and the relationship between network interfaces, nodes, switch ports, VLANs, port-channels, etc.


PowerFlex Networking Performance


This dashboard shows the switch and switch port KPIs like Throughout, Errors, Packet discards, etc.


PowerFlex Manager


You can see the service deployment details like service health, RCM compliance status, deployment status, etc. in this dashboard.


Hope it was useful. Cheers!

References